Vela Bay sells 386 units since April 2026 at a median of S$2,864 psf
Published 2 Nov 2026 · Vela Bay
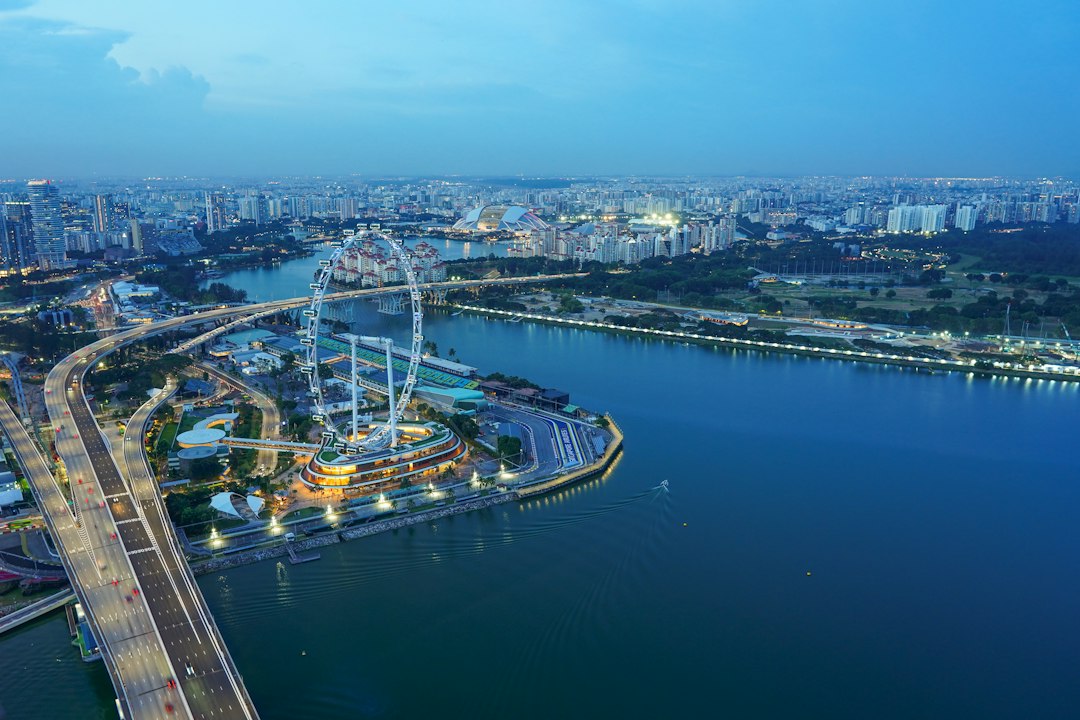
Vela Bay has recorded 386 developer sales since April 2026. That is 75.0% of the 515-unit project, at an overall median of S$2,864 psf — a launch now six months into its selling period.
Fifteen of those caveats were lodged in the three months to September 2026, based on caveats lodged with URA Data Service. The median psf moved 4.2% from S$2,866 psf in the first month to S$2,985 psf in September 2026.
Most sales came in the launch month
April 2026 was the busiest month, with 365 caveats. Monthly counts since then have stayed in single digits.
The monthly median psf has ranged from S$2,710 psf in May 2026 to S$3,011 psf in August 2026. The counts behind those months are small, at four and three caveats.
The table and chart below set out the monthly caveats and medians.
| Month | Caveats | Cumulative | Median psf |
|---|---|---|---|
| April 2026 | 365 | 365 | S$2,866 psf |
| May 2026 | 4 | 369 | S$2,710 psf |
| June 2026 | 2 | 371 | S$2,992 psf |
| July 2026 | 9 | 380 | S$2,829 psf |
| August 2026 | 3 | 383 | S$3,011 psf |
| September 2026 | 3 | 386 | S$2,985 psf |
Units of 50 to 69 sqm were the most sold size band
The 50 to 69 sqm band accounts for 184 caveats, at a median price of S$1,866,000 and a median of S$2,849 psf. Median area in the band is 678 sqft.
The highest band median psf is in units of 120 sqm and above, at S$3,034 psf across 18 caveats. Those units have a median price of S$4,298,000.
The breakdown by size band is below.
| Size band | Caveats | Median area | Median price | Median psf |
|---|---|---|---|---|
| under 50 sqm | 21 | 484 sqft | S$1,358,000 | S$2,804 psf |
| 50 to 69 sqm | 184 | 678 sqft | S$1,866,000 | S$2,849 psf |
| 70 to 89 sqm | 80 | 883 sqft | S$2,472,000 | S$2,791 psf |
| 90 to 119 sqm | 83 | 1,033 sqft | S$3,136,000 | S$2,925 psf |
| 120 sqm and above | 18 | 1,378 sqft | S$4,298,000 | S$3,034 psf |
Launch median is 87.9% above nearby resales
Within 1,000 m, 414 resales across 47 completed projects in the 24 months to September 2026 had a median of S$1,524 psf. The Vela Bay median is 87.9% above that.
The Bayshore, 266 m away, logged the most resales at 85, with a median of S$1,385 psf. Costa Del Sol, the closest at 151 m, had 67 resales at S$1,915 psf.
The nearby projects with the most resales are listed below.
| Project | Tenure | TOP | Distance | Resales | Median psf |
|---|---|---|---|---|---|
| The Bayshore | 99-year leasehold | — | 266 m | 85 | S$1,385 psf |
| Costa Del Sol | 99-year leasehold | — | 151 m | 67 | S$1,915 psf |
| Bayshore Park | 99-year leasehold | — | 426 m | 54 | S$1,294 psf |
| Casafina | 99-year leasehold | — | 928 m | 24 | S$1,254 psf |
| Eastern Lagoon | freehold | — | 801 m | 21 | S$1,655 psf |
| Parbury Hill Condominium | freehold | — | 682 m | 12 | S$1,746 psf |
| Lagoon View | 99-year leasehold | — | 862 m | 12 | S$1,145 psf |
| Laguna Green | 99-year leasehold | — | 769 m | 11 | S$1,449 psf |
Pinery Residences led other District 16 launches
Among other launches in District 16 over the 12 months to September 2026, Pinery Residences sold the most, with 412 caveats at a median of S$2,537 psf. Bagnall Haus followed with 10 caveats at S$2,594 psf.
Three landed transactions in the district were each a single caveat. Their medians range from S$2,543 psf to S$3,567 psf.
The district comparison is below.
| Project | Tenure | Expected TOP | Caveats | Median psf |
|---|---|---|---|---|
| Pinery Residences | 99-year leasehold | — | 412 | S$2,537 psf |
| Bagnall Haus | freehold | — | 10 | S$2,594 psf |
| Sceneca Residence | 99-year leasehold | — | 3 | S$1,778 psf |
| Lucky Hill | freehold | — | 1 | S$2,107 psf |
| Landed, Tanah Merah Kechil Road South | freehold | — | 1 | S$3,423 psf |
| Landed, Lucky Heights | freehold | — | 1 | S$3,567 psf |
| Landed, Sunbird Circle | freehold | — | 1 | S$2,543 psf |
Vela Bay has 386 of its 515 units sold after six months of sales. The last three of those months account for 15 caveats, against 365 in April 2026 alone.
Method: URA caveats for developer sales ('new sale') at the project, dated to the month. Size bands by the caveated floor area. The nearby comparison is resale caveats in completed projects within one kilometre over 24 months, unadjusted for size, age or floor. Units sold is the caveat count, which lags option exercises by weeks. Private figures are from URA Data Service caveats, HDB figures from data.gov.sg resale records, both loaded weekly by this site's ingest. Medians are of the non-excluded transactions in the period named. Sales flagged by the hygiene rules (related-party transfers, bulk deals, outliers) are left out. Every figure is indicative and drawn from recorded transactions, not a formal valuation.