What is your home worth?
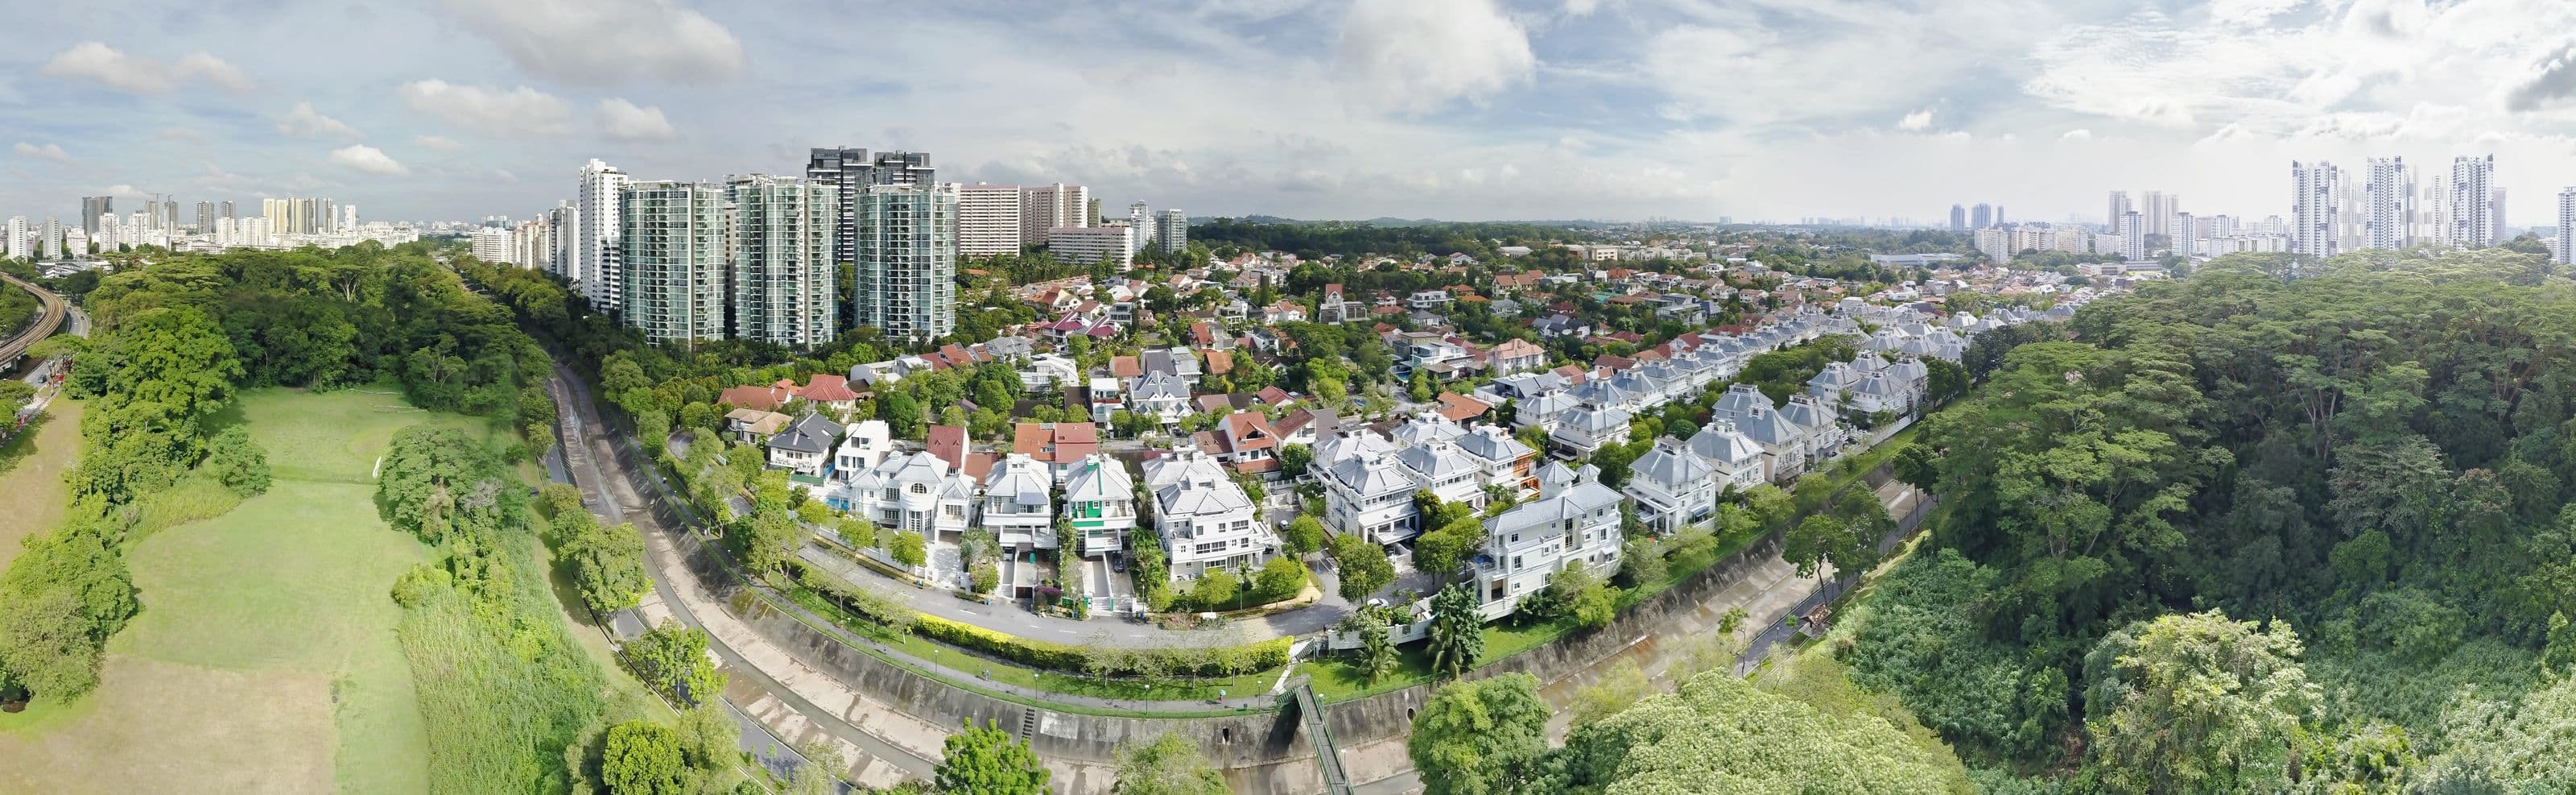
Mount Sinai and Holland Grove · Bob T CC BY-SA 4.0
Valued the way the professionals do it. For free.
A valuer prices your home from what similar homes nearby have sold for. So do we.
Every sale we used, and every sum we did to it
Each sale is listed, with its own columns: the adjustment for the quarter it sold in, for its floor, and for the lease. Check every step.
The sales we left out, and why
Bulk developer deals and prices far outside the normal range for the project stay on the page, struck through, with the reason beside them. Nothing is quietly dropped.
A range, not one number
A home is worth a band, not an exact figure. We tell you how many sales the range came from, and how far we had to look to find them.
We check our own answers
We re-run our old estimates against what those homes actually sold for, and show you the score for your project. Including the ones we got wrong.
Start with Landed, Binjai Hill: every sale we hold for it, the excluded ones included and labelled.
Latest sales
to Oct 2026- Sold Oct 2026Landed, Binjai HillS$38,500,000District 21 · 21,694 sqft land · S$1,775 psf
- Sold Oct 2026Capitol ParkS$24,500,000District 11 · 9,270 sqft land · S$2,643 psf
- Sold Oct 2026Landed, Matlock RiseS$16,388,888District 13 · 10,198 sqft land · S$1,607 psf
- Sold Oct 2026Blk 273A Bishan St 24S$1,711,000HDB · 5 ROOM · 120 sqm · S$14,258 psm
- Sold Oct 2026Blk 273B Bishan St 24S$1,688,000HDB · 5 ROOM · 120 sqm · S$14,067 psm
- Sold Oct 2026Blk 9 Boon Keng RdS$1,640,000HDB · 5 ROOM · 117 sqm · S$14,017 psm
The newest caveats and resale records we hold, half private and half HDB. Bad transactions are already filtered out.
Browse the newest launches
Selling now and not yet built, so there are no resales to value them against. Each page shows what nearby completed homes fetch.
- Chuan ParkDistrict 19 · TOP 2027
- Springleaf ResidenceDistrict 26
- The ContinuumDistrict 15 · TOP 2027
- The Reserve ResidencesDistrict 21
- Parktown ResidenceDistrict 18
- Canninghill PiersDistrict 6
- Zyon GrandDistrict 3
- One Marina GardensDistrict 1
- Lentor Hills ResidencesDistrict 26
- The OrieDistrict 12
- River GreenDistrict 9
- PenrithDistrict 3 · TOP 2029
Browse private projects by district
- District 1 · Raffles Place, Marina, Cecil 19
- District 2 · Tanjong Pagar, Anson 24
- District 3 · Tiong Bahru, Queenstown, Alexandra 47
- District 4 · Harbourfront, Telok Blangah, Sentosa 41
- District 5 · Clementi, Pasir Panjang, West Coast 141
- District 6 · City Hall, High Street 3
- District 7 · Bugis, Beach Road, Golden Mile 15
- District 8 · Little India, Farrer Park 72
- District 9 · Orchard, River Valley, Cairnhill 215
- District 10 · Bukit Timah, Holland, Tanglin 449
- District 11 · Novena, Newton, Thomson 235
- District 12 · Toa Payoh, Balestier, Serangoon 126
- District 13 · Macpherson, Potong Pasir, Braddell 106
- District 14 · Geylang, Eunos, Paya Lebar 270
- District 15 · Katong, Joo Chiat, East Coast 611
- District 16 · Bedok, Upper East Coast, Siglap 201
- District 17 · Changi, Loyang, Flora 66
- District 18 · Tampines, Pasir Ris 50
- District 19 · Hougang, Serangoon Gardens, Punggol 444
- District 20 · Bishan, Ang Mo Kio, Thomson 108
- District 21 · Upper Bukit Timah, Clementi Park, Ulu Pandan 152
- District 22 · Jurong, Boon Lay, Lakeside 32
- District 23 · Bukit Panjang, Hillview, Choa Chu Kang 112
- District 24 · Lim Chu Kang, Tengah 4
- District 25 · Woodlands, Kranji 26
- District 26 · Upper Thomson, Springleaf, Mandai 56
- District 27 · Yishun, Sembawang 70
- District 28 · Seletar, Yio Chu Kang 92
Browse HDB streets A to Z
Market context, latest published quarter
- HDB resale index202.5-0.1% q/q · Q3 2026
- Private, all222.5+1.4% q/q · Q3 2026
- Private, core central162.0+0.3% q/q · Q3 2026
- Private, rest of central226.20.0% q/q · Q3 2026
- Private, outside central277.3+2.3% q/q · Q3 2026
Both indices since 1975, beside interest rates, rents and supply