The Florence Residences: 92 Resales At A Median Of S$1,911 psf (Q3 2026)
Published 15 Nov 2026 · The Florence Residences
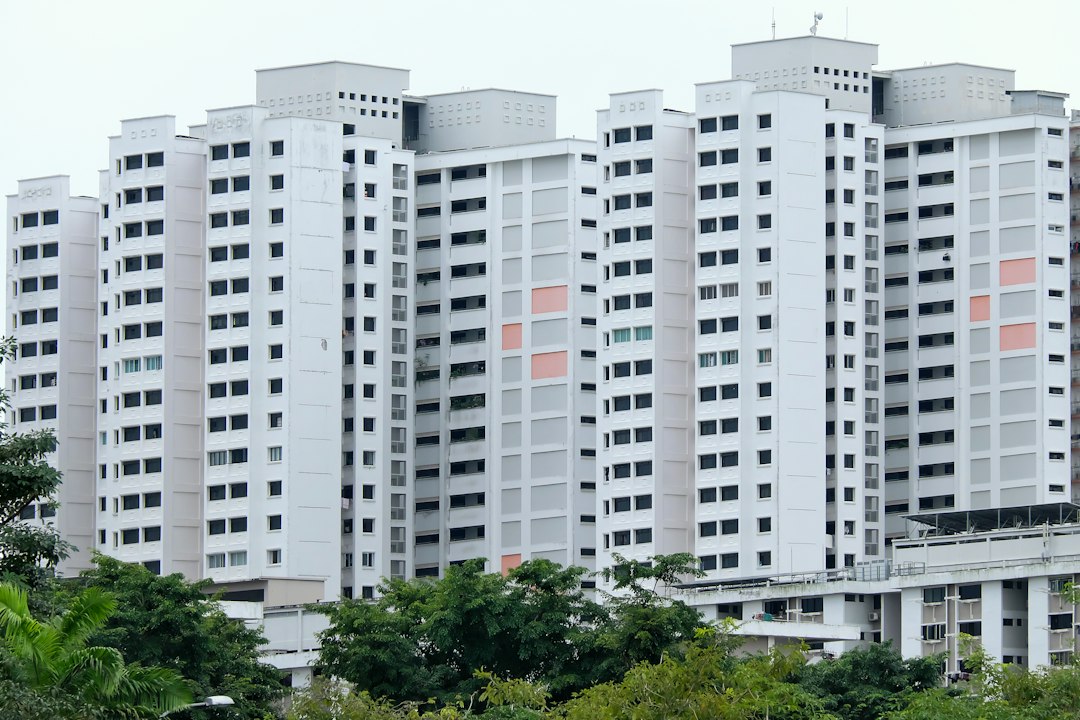
The Florence Residences is a 99 apartment project in District 19, with 91 years of lease left. If you own a unit here, rent one or are following the project, its recent transactions are the best guide to what has happened.
In this article, we look at six quarters of resale prices, resales by unit size and the highest prices paid. We also cover rents, the gross yield, the neighbouring projects and how this site's estimate has done.
The headline figure is a median of S$1,911 psf across 92 resales over Q4 2025 to Q3 2026, based on URA Data Service caveats. All figures are indicative and come from recorded transactions. None is a valuation of any home.
How Have Resale Prices Moved Across Six Quarters?
The quarterly median stood at S$1,834 psf in Q2 2025, from 9 sales. By Q3 2026 it was S$1,931 psf, from 24 sales. That is a move of +5.3% between the first and last quarter shown.
The table below lists the resales in each quarter, with the median and the spread around it. The chart below plots the median alone. Q3 2025 had the lowest median at S$1,788 psf. Q2 2026 had the highest at S$1,941 psf.
Note that the number of sales changes a lot from quarter to quarter, from 9 in Q2 2025 to 36 in Q2 2026. A quarter with few sales can swing more than one with many.
| Quarter | Resales | Median psf | 25th percentile | 75th percentile |
|---|---|---|---|---|
| Q2 2025 | 9 | S$1,834 psf | S$1,774 psf | S$1,894 psf |
| Q3 2025 | 24 | S$1,788 psf | S$1,730 psf | S$1,912 psf |
| Q4 2025 | 12 | S$1,900 psf | S$1,842 psf | S$1,969 psf |
| Q1 2026 | 20 | S$1,877 psf | S$1,834 psf | S$1,943 psf |
| Q2 2026 | 36 | S$1,941 psf | S$1,834 psf | S$1,996 psf |
| Q3 2026 | 24 | S$1,931 psf | S$1,842 psf | S$2,006 psf |
Which Unit Sizes Traded Most, And What Were The Top Prices?
Units of 50 to 69 sqm were the most traded size. There were 40 resales at a median of S$1,261,444, or S$1,894 psf.
The table below breaks resales down by size band for Q4 2025 to Q3 2026. The median psf rises from S$1,755 psf for units under 50 sqm to S$2,001 psf for units of 90 to 119 sqm. The largest band, 120 sqm and above, has only 6 resales, so read it with care.
The highest resale price in the window was S$3,420,000 in Q3 2026. It was for a 1,679 sqft unit in the 06-10 storey range, at S$2,037 psf. The second table below lists the five highest prices. Note that all five are for units of 1,668 sqft or 1,679 sqft.
| Size band | Resales | Median area | Median price | Median psf |
|---|---|---|---|---|
| under 50 sqm | 18 | 484 sqft | S$874,000 | S$1,755 psf |
| 50 to 69 sqm | 40 | 667 sqft | S$1,261,444 | S$1,894 psf |
| 70 to 89 sqm | 13 | 926 sqft | S$1,830,088 | S$1,976 psf |
| 90 to 119 sqm | 15 | 1,012 sqft | S$2,120,000 | S$2,001 psf |
| 120 sqm and above | 6 | 1,674 sqft | S$3,290,000 | S$1,972 psf |
| Quarter | Storey range | Area | Price | Per sqft |
|---|---|---|---|---|
| Q3 2026 | 06-10 | 1,679 sqft | S$3,420,000 | S$2,037 psf |
| Q2 2026 | 11-15 | 1,679 sqft | S$3,400,000 | S$2,025 psf |
| Q4 2025 | 11-15 | 1,668 sqft | S$3,300,000 | S$1,978 psf |
| Q2 2026 | 06-10 | 1,668 sqft | S$3,280,000 | S$1,966 psf |
| Q1 2026 | 11-15 | 1,679 sqft | S$3,260,000 | S$1,941 psf |
What Are The Rents And The Gross Yield?
The rental figures below come from URA rental contracts. In Q3 2026 there were 95 contracts at a median of S$5.31 psf a month. The median rent was S$3,300.
The table below shows the four quarters from Q4 2025. The median monthly rent stayed between S$3,250 in Q1 2026 and S$3,350 in Q2 2026. Contract counts ranged from 95 to 137.
Set against the resale median, the rent gives a gross yield of about 3.3%. This is this site's own engine measure. It uses the rent and the resale median only, and it leaves out costs and vacancies.
| Quarter | Contracts | Median rent (S$ psf a month) | Median monthly rent |
|---|---|---|---|
| Q4 2025 | 130 | 5.2 | S$3,300 |
| Q1 2026 | 137 | 5.4 | S$3,250 |
| Q2 2026 | 125 | 5.2 | S$3,350 |
| Q3 2026 | 95 | 5.3 | S$3,300 |
How Does It Compare With Its Neighbours?
Over the same four quarters, the District 19 resale median was S$1,652 psf from 2,285 sales. The Florence Residences sits +15.7% above it.
The table below lists resales within 1 km, by project. Kovan Melody had the most resales at 23, with a median of S$1,809 psf. Kovan Regency, the closest at 393 m, had the highest median at S$2,037 psf. Kovan Grandeur had the lowest at S$1,455 psf, from 6 resales.
Note that the list mixes freehold and 99-year leasehold projects. The TOP column is blank for all of them in our data, so age is not compared here.
| Project | Tenure | TOP | Distance | Resales | Median psf |
|---|---|---|---|---|---|
| Kovan Melody | 99-year leasehold | — | 792 m | 23 | S$1,809 psf |
| Stars Of Kovan | 99-year leasehold | — | 625 m | 20 | S$1,945 psf |
| The Tembusu | freehold | — | 717 m | 15 | S$1,964 psf |
| Kovan Residences | 99-year leasehold | — | 671 m | 14 | S$1,872 psf |
| Trilive | freehold | — | 855 m | 12 | S$1,874 psf |
| Kovan Regency | 99-year leasehold | — | 393 m | 11 | S$2,037 psf |
| Bliss@Kovan | freehold | — | 528 m | 8 | S$1,648 psf |
| Kovan Grandeur | 99-year leasehold | — | 961 m | 6 | S$1,455 psf |
Summary
The Florence Residences recorded 92 resales over Q4 2025 to Q3 2026 at a median of S$1,911 psf. The quarterly median went from S$1,834 psf in Q2 2025 to S$1,931 psf in Q3 2026. The 50 to 69 sqm band was the most traded, and the gross yield was about 3.3% on Q3 2026 rents.
This site's estimate was tested against 82 later sales here as of Q1 2026. Its median error was 3.9%, and 33% of sales fell inside the stated range. These figures are indicative, drawn from recorded transactions. Small quarterly counts and the mix of unit sizes can move any median, and the data does not settle the value of one particular home.
Method: URA resale caveats at the project (developer sales and sub-sales excluded) by the quarter of the sale month. Size bands by caveated floor area. Rents are URA rental contracts at the project, and the gross yield is the mean of the quarterly median rents per square foot, annualised, over the four-quarter resale median per square foot, before any cost. Lease left is the tenure less the years since the lease started, as recorded. The estimate accuracy is this site's backtest: the engine run as of the quarter named, compared with the sales since. Private figures are from URA Data Service caveats, HDB figures from data.gov.sg resale records, both loaded weekly by this site's ingest. Medians are of the non-excluded transactions in the period named. Sales flagged by the hygiene rules (related-party transfers, bulk deals, outliers) are left out. Every figure is indicative and drawn from recorded transactions, not a formal valuation. Facilities, layouts and photographs, where shown, are as supplied by the developer or seen on our own visit, and are not engine data.