Eight Riversuites: 52 Resales At A Median Of S$1,875 psf — But The Quarterly Median Has Barely Moved In Two Years
Published 2 Oct 2026 · Eight Riversuites
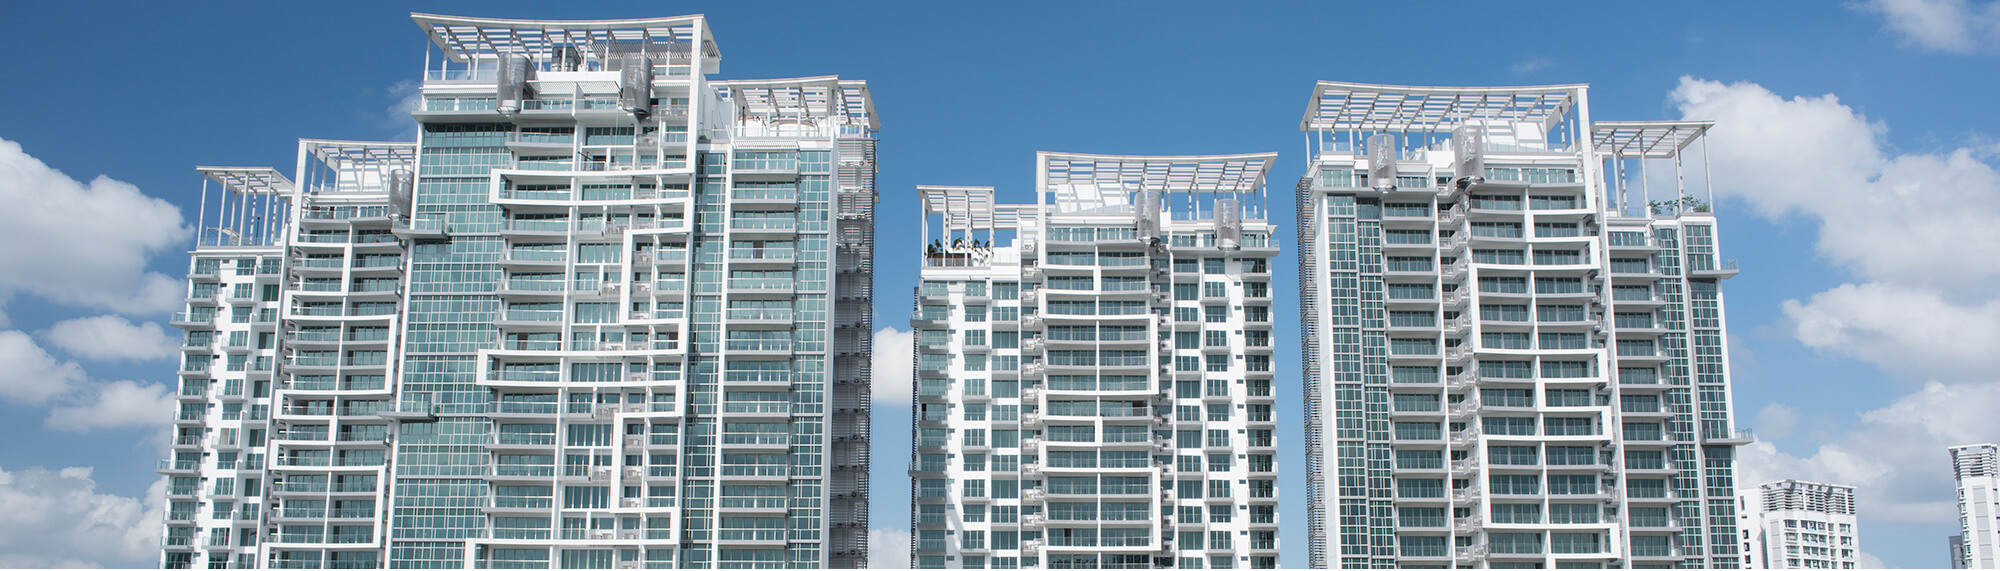
A project can be busy and still go nowhere on price. Eight Riversuites is a good example of that, and the gap between its volume and its price movement is what pulled us into the numbers.
According to URA Data Service caveats, the 99-year leasehold project in District 12, with 84 years of lease left, recorded 52 resales over 3Q2025 to 2Q2026 at a median of S$1,875 psf. Over the same four quarters, the District 12 resale median was S$1,748 psf from 389 sales, so Eight Riversuites sits +7.2% against its district. Stretch the window to eight quarters and the quarterly median moved +2.5%, from S$1,852 psf in 3Q2024 to S$1,898 psf in 2Q2026. Here is what stood out to us when we worked through the tables.
The quarterly median has ended up almost where it started two years ago
The eight-quarter series is not a trend line so much as a flat band with wobble inside it. The low point is S$1,841 psf in 1Q2026 and the high points are S$1,903 psf in 2Q2025 and again in 4Q2025. Everything else falls between. Volume is steady too, mostly 12 to 15 resales a quarter, with one thin quarter of seven sales in 1Q2025. That thin quarter matters when you read the line. A median off seven transactions can swing on a single unusual unit, so we would not read too much into its position in the series.
The percentile columns say more than the median alone. In 2Q2025 the 25th percentile was S$1,873 psf and the 75th was S$1,945 psf, a narrow spread. In 4Q2025 the same median of S$1,903 psf came with a 25th percentile of S$1,719 psf. Same middle, much wider distribution. That points to a mix effect: which sizes and which floors happened to transact. The table and chart below show both the medians and the counts behind them.
| Quarter | Resales | Median psf | 25th percentile | 75th percentile |
|---|---|---|---|---|
| Q3 2024 | 14 | S$1,852 psf | S$1,792 psf | S$1,880 psf |
| Q4 2024 | 14 | S$1,844 psf | S$1,745 psf | S$1,901 psf |
| Q1 2025 | 7 | S$1,858 psf | S$1,720 psf | S$1,910 psf |
| Q2 2025 | 15 | S$1,903 psf | S$1,873 psf | S$1,945 psf |
| Q3 2025 | 13 | S$1,874 psf | S$1,794 psf | S$1,914 psf |
| Q4 2025 | 15 | S$1,903 psf | S$1,719 psf | S$1,940 psf |
| Q1 2026 | 12 | S$1,841 psf | S$1,710 psf | S$1,888 psf |
| Q2 2026 | 12 | S$1,898 psf | S$1,815 psf | S$1,934 psf |
The smallest units here carry the highest psf, and the largest the lowest
Split the 52 resales by size and the psf ladder runs in one direction. Units of 50 to 69 sqm, at a median area of 700 sqft, recorded 14 resales at a median of S$1,357,500, or S$1,940 psf. The under 50 sqm band, median area 441 sqft, did 8 resales at a median of S$842,444 (S$1,909 psf). At the other end, the 120 sqm and above band recorded three resales at a median of S$2,350,000 (S$1,575 psf).
The busiest band is 70 to 89 sqm: 16 resales, median area 936 sqft, median price S$1,605,000 at S$1,809 psf. That band alone accounts for the largest share of the window's activity. The 90 to 119 sqm band follows with 11 resales at a median of S$2,000,000 (S$1,716 psf).
Keep the counts in view. Three sales in the largest band is a very small sample, and a median drawn from three transactions can be moved entirely by one of them. The pattern across the other four bands is more solidly supported. The table below sets out each band.
| Size band | Resales | Median area | Median price | Median psf |
|---|---|---|---|---|
| under 50 sqm | 8 | 441 sqft | S$842,444 | S$1,909 psf |
| 50 to 69 sqm | 14 | 700 sqft | S$1,357,500 | S$1,940 psf |
| 70 to 89 sqm | 16 | 936 sqft | S$1,605,000 | S$1,809 psf |
| 90 to 119 sqm | 11 | 1,195 sqft | S$2,000,000 | S$1,716 psf |
| 120 sqm and above | 3 | 1,830 sqft | S$2,350,000 | S$1,575 psf |
Rental volume is heavy, and 2Q2026 recorded the highest psf rent of the four quarters
Eight Riversuites is active on the leasing side. Based on URA rental contract data, the project recorded 61 contracts in 2Q2026 at a median of S$6.56 psf a month, with a median monthly rent of S$3,650. The three quarters before it ran 69, 56 and 57 contracts. That is a consistent flow of leases for a single project.
Notice that the psf rent and the dollar rent do not move together. The highest median monthly rent in the table is S$3,900 in 3Q2025, but that quarter also carries the lowest psf rent at 6.0. The 2Q2026 figure is the opposite case: the highest psf rent of the four, with a lower dollar median. Unit size is doing the work there, and the table does not break contracts down by size, so we cannot settle it further.
Set the 2Q2026 rental median against the resale median and our engine measures a gross yield of about 4.0%. That is a measured figure from recorded contracts and recorded caveats, not a valuation of any unit.
| Quarter | Contracts | Median rent (S$ psf a month) | Median monthly rent |
|---|---|---|---|
| Q3 2025 | 69 | 6.0 | S$3,900 |
| Q4 2025 | 56 | 6.3 | S$3,475 |
| Q1 2026 | 57 | 6.0 | S$3,800 |
| Q2 2026 | 61 | 6.6 | S$3,650 |
Against its immediate neighbours, Eight Riversuites sits in the upper half but not at the top
Within 1 km, eight projects recorded resales over the same four quarters. The highest median psf belongs to Jui Residences, freehold, 575 m away, at S$1,990 psf from eight resales. The Venue Residences, 99-year leasehold and 957 m away, recorded 13 resales at S$1,951 psf. Both sit above Eight Riversuites' S$1,875 psf.
Below it, the 999-year leasehold projects cluster lower. Riverbay recorded 15 resales at S$1,615 psf, Beacon Heights 10 at S$1,562 psf, and Riviera 38 six at S$1,583 psf. Among the freehold names, Moonstone Residences recorded five resales at S$1,566 psf and City Regency four at S$1,541 psf. Tenure alone clearly does not order this list.
The counts are thin at the bottom of the table, four and five sales in places, and the projects differ in age, size and unit mix. So this is a neighbourhood reference, not a like-for-like comparison. The table below lists each project with its distance and resale count.
| Project | Tenure | TOP | Distance | Resales | Median psf |
|---|---|---|---|---|---|
| Riverbay | 999-year leasehold | — | 774 m | 15 | S$1,615 psf |
| The Venue Residences | 99-year leasehold | — | 957 m | 13 | S$1,951 psf |
| Beacon Heights | 999-year leasehold | — | 623 m | 10 | S$1,562 psf |
| Jui Residences | freehold | — | 575 m | 8 | S$1,990 psf |
| Riviera 38 | 999-year leasehold | — | 770 m | 6 | S$1,583 psf |
| One St Michael's | freehold | — | 375 m | 5 | S$1,882 psf |
| Moonstone Residences | freehold | — | 662 m | 5 | S$1,566 psf |
| City Regency | freehold | — | 567 m | 4 | S$1,541 psf |
The largest price in the window is not the largest psf in the window
The highest resale price over the four quarters was S$2,980,000 in 1Q2026, a 1,830 sqft unit in the 26-30 storey range. On a psf basis that works out to S$1,629 psf, below the project's four-quarter median. The second largest price, S$2,350,000 in 2Q2026 for 1,916 sqft on the same storey band, comes in at S$1,227 psf, the lowest figure in the whole table.
The strongest psf among the five is the S$2,188,888 sale in 2Q2026, a 1,195 sqft unit in the 21-25 storey range at S$1,832 psf. A 1,195 sqft unit in the same storey band changed hands at S$2,050,000 (S$1,716 psf) in 3Q2025.
This is the same point the size bands made, seen from the top of the price list. Big absolute numbers come from big floor areas here, and the per-square-foot figures on those sales sit under the project median. The table below sets out the five highest prices.
| Quarter | Storey range | Area | Price | Per sqft |
|---|---|---|---|---|
| Q1 2026 | 26-30 | 1,830 sqft | S$2,980,000 | S$1,629 psf |
| Q2 2026 | 26-30 | 1,916 sqft | S$2,350,000 | S$1,227 psf |
| Q2 2026 | 21-25 | 1,195 sqft | S$2,188,888 | S$1,832 psf |
| Q4 2025 | 06-10 | 1,324 sqft | S$2,085,000 | S$1,575 psf |
| Q3 2025 | 21-25 | 1,195 sqft | S$2,050,000 | S$1,716 psf |
Our own estimate has been checked against 46 later sales at this project
We also test our estimate against what actually transacted afterwards. As of 4Q2025, 46 later sales at Eight Riversuites had been tested. The median error was 3.6%, and 33% of those sales fell inside the stated range.
Both figures are worth reading together. A median error of 3.6% means half the tested sales landed closer than that and half landed further. The 33% hit rate is about how wide the stated range is, not about the centre of the estimate. On a project with this spread between size bands, 441 sqft at S$1,909 psf against 1,830 sqft at S$1,629 psf, a narrow range will miss more often than it lands. Every figure here is indicative and drawn from recorded transactions.
A few things the data does not settle. The 1Q2025 median rests on seven sales, and the largest size band on three, so parts of this picture are thin. The rental table gives contracts and medians but no size split, which is where the gap between 6.6 psf a month and a S$3,650 median rent would be explained. And the flat eight-quarter path, +2.5% from 3Q2024 to 2Q2026, has a mix story sitting behind it that the percentile columns only hint at. In the next quarter's URA caveats, the two figures we would watch are the 25th-to-75th spread and whether the 70 to 89 sqm band keeps supplying the bulk of the volume.
One median psf, taken alone, tells you very little about a project like this one. The same number can come from a tight cluster of similar units or from a wide scatter that happens to balance. What makes it readable is everything around it: the counts, the size bands, the leases signed in the same quarter, and the projects down the road. Read in that order, Eight Riversuites looks like a high-turnover project trading in a steady band, with its per-square-foot figures set largely by unit size.
Method: URA resale caveats at the project (developer sales and sub-sales excluded) by the quarter of the sale month. Size bands by caveated floor area. Rents are URA rental contracts at the project, and the gross yield is the mean of the quarterly median rents per square foot, annualised, over the four-quarter resale median per square foot, before any cost. Lease left is the tenure less the years since the lease started, as recorded. The estimate accuracy is this site's backtest: the engine run as of the quarter named, compared with the sales since. Private figures are from URA Data Service caveats, HDB figures from data.gov.sg resale records, both loaded weekly by this site's ingest. Medians are of the non-excluded transactions in the period named. Sales flagged by the hygiene rules (related-party transfers, bulk deals, outliers) are left out. Every figure is indicative and drawn from recorded transactions, not a formal valuation.