Caribbean At Keppel Bay Just Crossed S$2,000 psf — With 72 Years Of Lease Left And A Project Record Of S$5.7M
Published 9 Oct 2026 · Caribbean At Keppel Bay
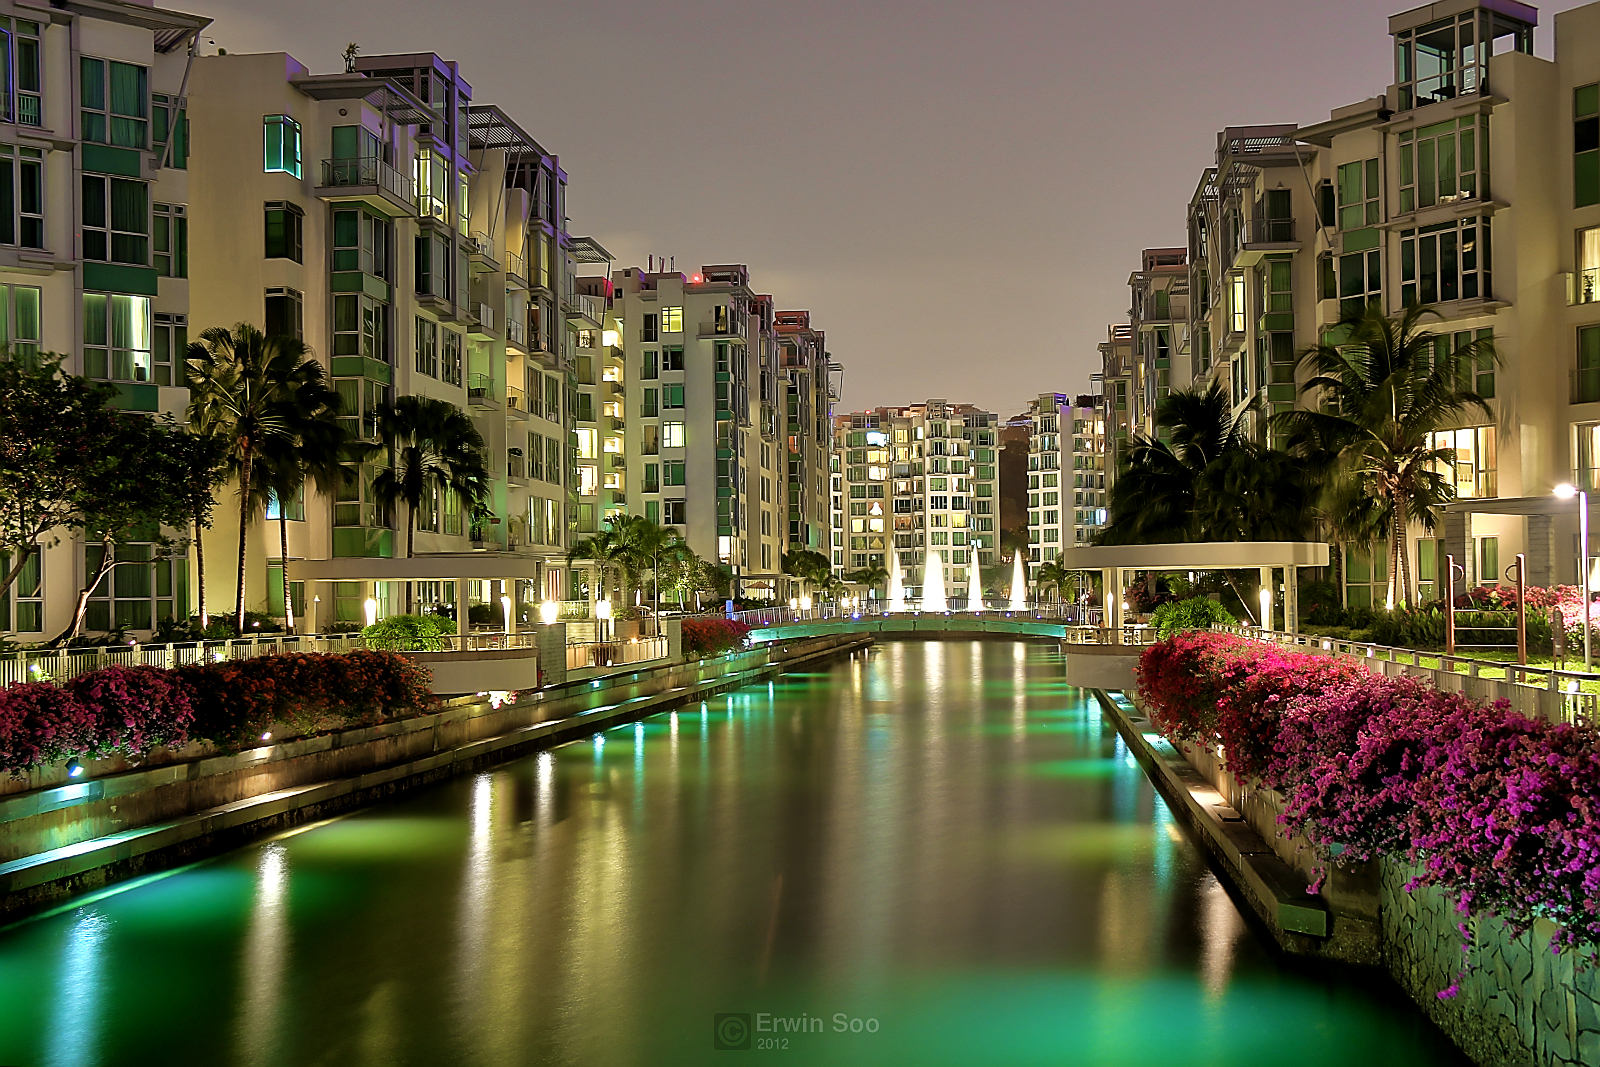
A 99-year project with 72 years of lease left is not where you would expect a fresh high in the median. Yet that is what the quarterly numbers at Caribbean At Keppel Bay show, and the rental file beside it is unusually busy for a single development.
According to URA Data Service caveats, Caribbean At Keppel Bay recorded 41 resales over the four quarters from 3Q2025 to 2Q2026, at a median of S$1,949 psf. Across the eight quarters shown, the quarterly median moved +6.0%, from S$1,896 psf in 3Q2024 on 10 sales to S$2,010 psf in 2Q2026 on 8 sales. Over the same four-quarter window, District 4 recorded a resale median of S$1,781 psf from 275 sales. Caribbean sits +9.4% against that district figure. Here is what stood out to us when we walked through the tables.
The quarterly median has climbed in steps rather than in one jump
The eight-quarter path is not a straight line, but the direction is consistent. The median sat at S$1,896 psf in 3Q2024 and S$1,901 psf in the quarter after. It then moved up through 1Q2025 and 2Q2025, dipped to S$1,913 psf in 3Q2025, and recovered to S$1,967 psf in 4Q2025. The latest reading, S$2,010 psf in 2Q2026, is the only one above S$2,000 psf in the window.
Two things are worth holding in mind. Quarterly counts here are small, ranging from 6 sales in 4Q2025 to 14 in 1Q2026. A handful of transactions can move a median either way. The spread helps a little: in 2Q2026, the 25th percentile was S$1,930 psf and the 75th was S$2,079 psf, both higher than the equivalent readings two years earlier. That suggests the lift is not resting on one outlier alone, though the mix of floors and sizes sold each quarter still differs.
The table and chart below set out the quarterly figures.
| Quarter | Resales | Median psf | 25th percentile | 75th percentile |
|---|---|---|---|---|
| Q3 2024 | 10 | S$1,896 psf | S$1,802 psf | S$1,943 psf |
| Q4 2024 | 10 | S$1,901 psf | S$1,814 psf | S$1,930 psf |
| Q1 2025 | 8 | S$1,943 psf | S$1,854 psf | S$1,982 psf |
| Q2 2025 | 9 | S$1,954 psf | S$1,873 psf | S$1,959 psf |
| Q3 2025 | 13 | S$1,913 psf | S$1,888 psf | S$1,973 psf |
| Q4 2025 | 6 | S$1,967 psf | S$1,883 psf | S$2,028 psf |
| Q1 2026 | 14 | S$1,961 psf | S$1,911 psf | S$2,022 psf |
| Q2 2026 | 8 | S$2,010 psf | S$1,930 psf | S$2,079 psf |
The three size bands are trading at almost the same rate
Size usually separates a project's pricing. At Caribbean At Keppel Bay over 3Q2025 to 2Q2026, it barely does. The 70 to 89 sqm band recorded 7 resales at a median of S$1,948 psf. The 90 to 119 sqm band, the most traded with 17 resales, came in at S$1,949 psf. The 120 sqm and above band, also 17 resales, sat at S$1,956 psf.
The absolute prices do separate, as you would expect. Median price runs from S$1,730,000 on a median area of 893 sqft in the smallest band, to S$2,420,000 on 1,249 sqft, to S$2,880,000 on a median 1,518 sqft. So the step up in quantum is clear while the rate is flat across the three bands.
What the table cannot settle is floor level and stack. Caveats group storeys into ranges, and the band medians pool whatever sold. A flat profile across sizes is still notable in a project where units range widely in area. The breakdown is below.
| Size band | Resales | Median area | Median price | Median psf |
|---|---|---|---|---|
| 70 to 89 sqm | 7 | 893 sqft | S$1,730,000 | S$1,948 psf |
| 90 to 119 sqm | 17 | 1,249 sqft | S$2,420,000 | S$1,949 psf |
| 120 sqm and above | 17 | 1,518 sqft | S$2,880,000 | S$1,956 psf |
Rental activity is heavy, at 62 to 72 contracts a quarter
The rental file is the busiest part of this project's record. URA logged 63 contracts in 3Q2025, 72 in 4Q2025, 68 in 1Q2026 and 62 in 2Q2026. That is a steady stream of leases for a single development, quarter after quarter.
The rates themselves have moved very little. The median sat at 5.8 psf a month in 3Q2025, 5.7 in 4Q2025, 5.9 in 1Q2026 and 5.8 again in 2Q2026. Median monthly rent tracked a narrow band too: S$7,250, then S$7,150, then S$7,050, then back to S$7,250. Set the 2Q2026 rental median of S$5.76 psf a month against the resale median, and our engine measures a gross yield of about 3.5%.
That yield figure is indicative, drawn from recorded contracts and recorded resales, not from any assessment of a particular unit. It also sits before maintenance, tax and vacancy. The quarterly rental table follows.
| Quarter | Contracts | Median rent (S$ psf a month) | Median monthly rent |
|---|---|---|---|
| Q3 2025 | 63 | 5.8 | S$7,250 |
| Q4 2025 | 72 | 5.7 | S$7,150 |
| Q1 2026 | 68 | 5.9 | S$7,050 |
| Q2 2026 | 62 | 5.8 | S$7,250 |
Within one kilometre, the spread between projects runs from S$1,510 psf to S$2,456 psf
Caribbean's neighbours do not price as one block. Reflections At Keppel Bay, 401 m away, was the most active nearby with 59 resales at a median of S$1,694 psf. Corals At Keppel Bay, the closest at 295 m, recorded 16 resales at S$2,033 psf. Skyline Residences, freehold and 911 m out, posted 16 resales at S$2,273 psf.
Below those, the counts thin out quickly. Harbour View Towers recorded 3 resales at S$1,510 psf. Harbourlights had 2 at S$1,842 psf. The Reef At King's Dock shows a single resale at S$2,456 psf, The Foresta @ Mount Faber a single one at S$2,079 psf, and a landed transaction on Wishart Road at S$1,498 psf. One or two caveats cannot describe a project's level, so read those rows as data points rather than medians in any useful sense.
Caribbean's own S$1,949 psf over the window sits between Reflections and Corals. Tenure, age and unit mix all differ across this list, and the table does not hold any of them constant. It is below.
| Project | Tenure | TOP | Distance | Resales | Median psf |
|---|---|---|---|---|---|
| Reflections At Keppel Bay | 99-year leasehold | — | 401 m | 59 | S$1,694 psf |
| Corals At Keppel Bay | 99-year leasehold | — | 295 m | 16 | S$2,033 psf |
| Skyline Residences | freehold | — | 911 m | 16 | S$2,273 psf |
| Harbour View Towers | 99-year leasehold | — | 852 m | 3 | S$1,510 psf |
| Harbourlights | freehold | — | 926 m | 2 | S$1,842 psf |
| Landed, Wishart Road | freehold | — | 308 m | 1 | S$1,498 psf |
| The Reef At King's Dock | 99-year leasehold | — | 409 m | 1 | S$2,456 psf |
| The Foresta @ Mount Faber | freehold | — | 368 m | 1 | S$2,079 psf |
The largest sale by price was also the lowest by rate
The top of the price table is where the project's range shows most clearly. The highest resale in the window was S$5,700,000 in 3Q2025, for a 4,650 sqft unit in the 06-10 storey range. On a rate basis that worked out to S$1,226 psf, the lowest figure in the whole top-five list.
The next four tell a different story. A 2,433 sqft unit on the 01-05 storey range went for S$5,008,888 in 4Q2025, at S$2,059 psf. Then S$4,000,000 for 2,077 sqft at S$1,925 psf, and S$3,800,000 for 1,873 sqft at S$2,029 psf, both in 3Q2025. The most recent of the five, in 2Q2026, was S$3,550,000 for 1,636 sqft at S$2,170 psf, the highest rate on the list.
That inverse pattern between size and rate at the very top is common enough in large-unit caveats. It also means the headline S$5.7M does not pull the project median upward in the way a reader might assume. The five sales are below.
| Quarter | Storey range | Area | Price | Per sqft |
|---|---|---|---|---|
| Q3 2025 | 06-10 | 4,650 sqft | S$5,700,000 | S$1,226 psf |
| Q4 2025 | 01-05 | 2,433 sqft | S$5,008,888 | S$2,059 psf |
| Q3 2025 | 01-05 | 2,077 sqft | S$4,000,000 | S$1,925 psf |
| Q3 2025 | 01-05 | 1,873 sqft | S$3,800,000 | S$2,029 psf |
| Q2 2026 | 01-05 | 1,636 sqft | S$3,550,000 | S$2,170 psf |
Our own estimate has a median error of 2.7% at this project
We test our estimate against sales recorded after the estimate was made. As of 4Q2025, 28 later sales at Caribbean At Keppel Bay were available for that test. The median error came in at 2.7%, and 32% of those sales landed inside the stated range.
Those two figures say different things. The median error describes how close the central estimate typically sat to the recorded price. The share inside the range describes how often the band we publish actually contained the outcome. At 32%, the band captured under a third of them, which is worth knowing before you lean on any single figure for a single unit.
Everything here comes from recorded transactions: URA Data Service caveats for resales and rental contracts, and our own engine for the measured yield and backtest. None of it is a formal valuation of any home in the project.
A few things the figures leave open. The 2Q2026 median of S$2,010 psf rests on 8 sales, which is on the thin side, and the quarter before it had 14. Whether the project holds above S$2,000 psf is something the next quarter's caveats will answer rather than this one. The rental side is worth watching too: contract counts have run between 62 and 72 across four quarters, while the median monthly rent has moved inside a narrow band. And the flat rate across all three size bands may or may not persist once the mix of floors and stacks changes.
One quarter at one project rarely settles anything on its own. What gives these numbers weight is the eight-quarter line behind them, the district figure beside them, and the neighbour table around them. Read together, they place Caribbean At Keppel Bay above its district median and inside a tight cluster of Keppel Bay pricing. Read alone, any one of them would tell you much less.
Method: URA resale caveats at the project (developer sales and sub-sales excluded) by the quarter of the sale month. Size bands by caveated floor area. Rents are URA rental contracts at the project, and the gross yield is the mean of the quarterly median rents per square foot, annualised, over the four-quarter resale median per square foot, before any cost. Lease left is the tenure less the years since the lease started, as recorded. The estimate accuracy is this site's backtest: the engine run as of the quarter named, compared with the sales since. Private figures are from URA Data Service caveats, HDB figures from data.gov.sg resale records, both loaded weekly by this site's ingest. Medians are of the non-excluded transactions in the period named. Sales flagged by the hygiene rules (related-party transfers, bulk deals, outliers) are left out. Every figure is indicative and drawn from recorded transactions, not a formal valuation.