Arina East Residences: 79 Units Sold At A Median Of S$2,877 psf (September 2026)
Published 24 Oct 2026 · Arina East Residences
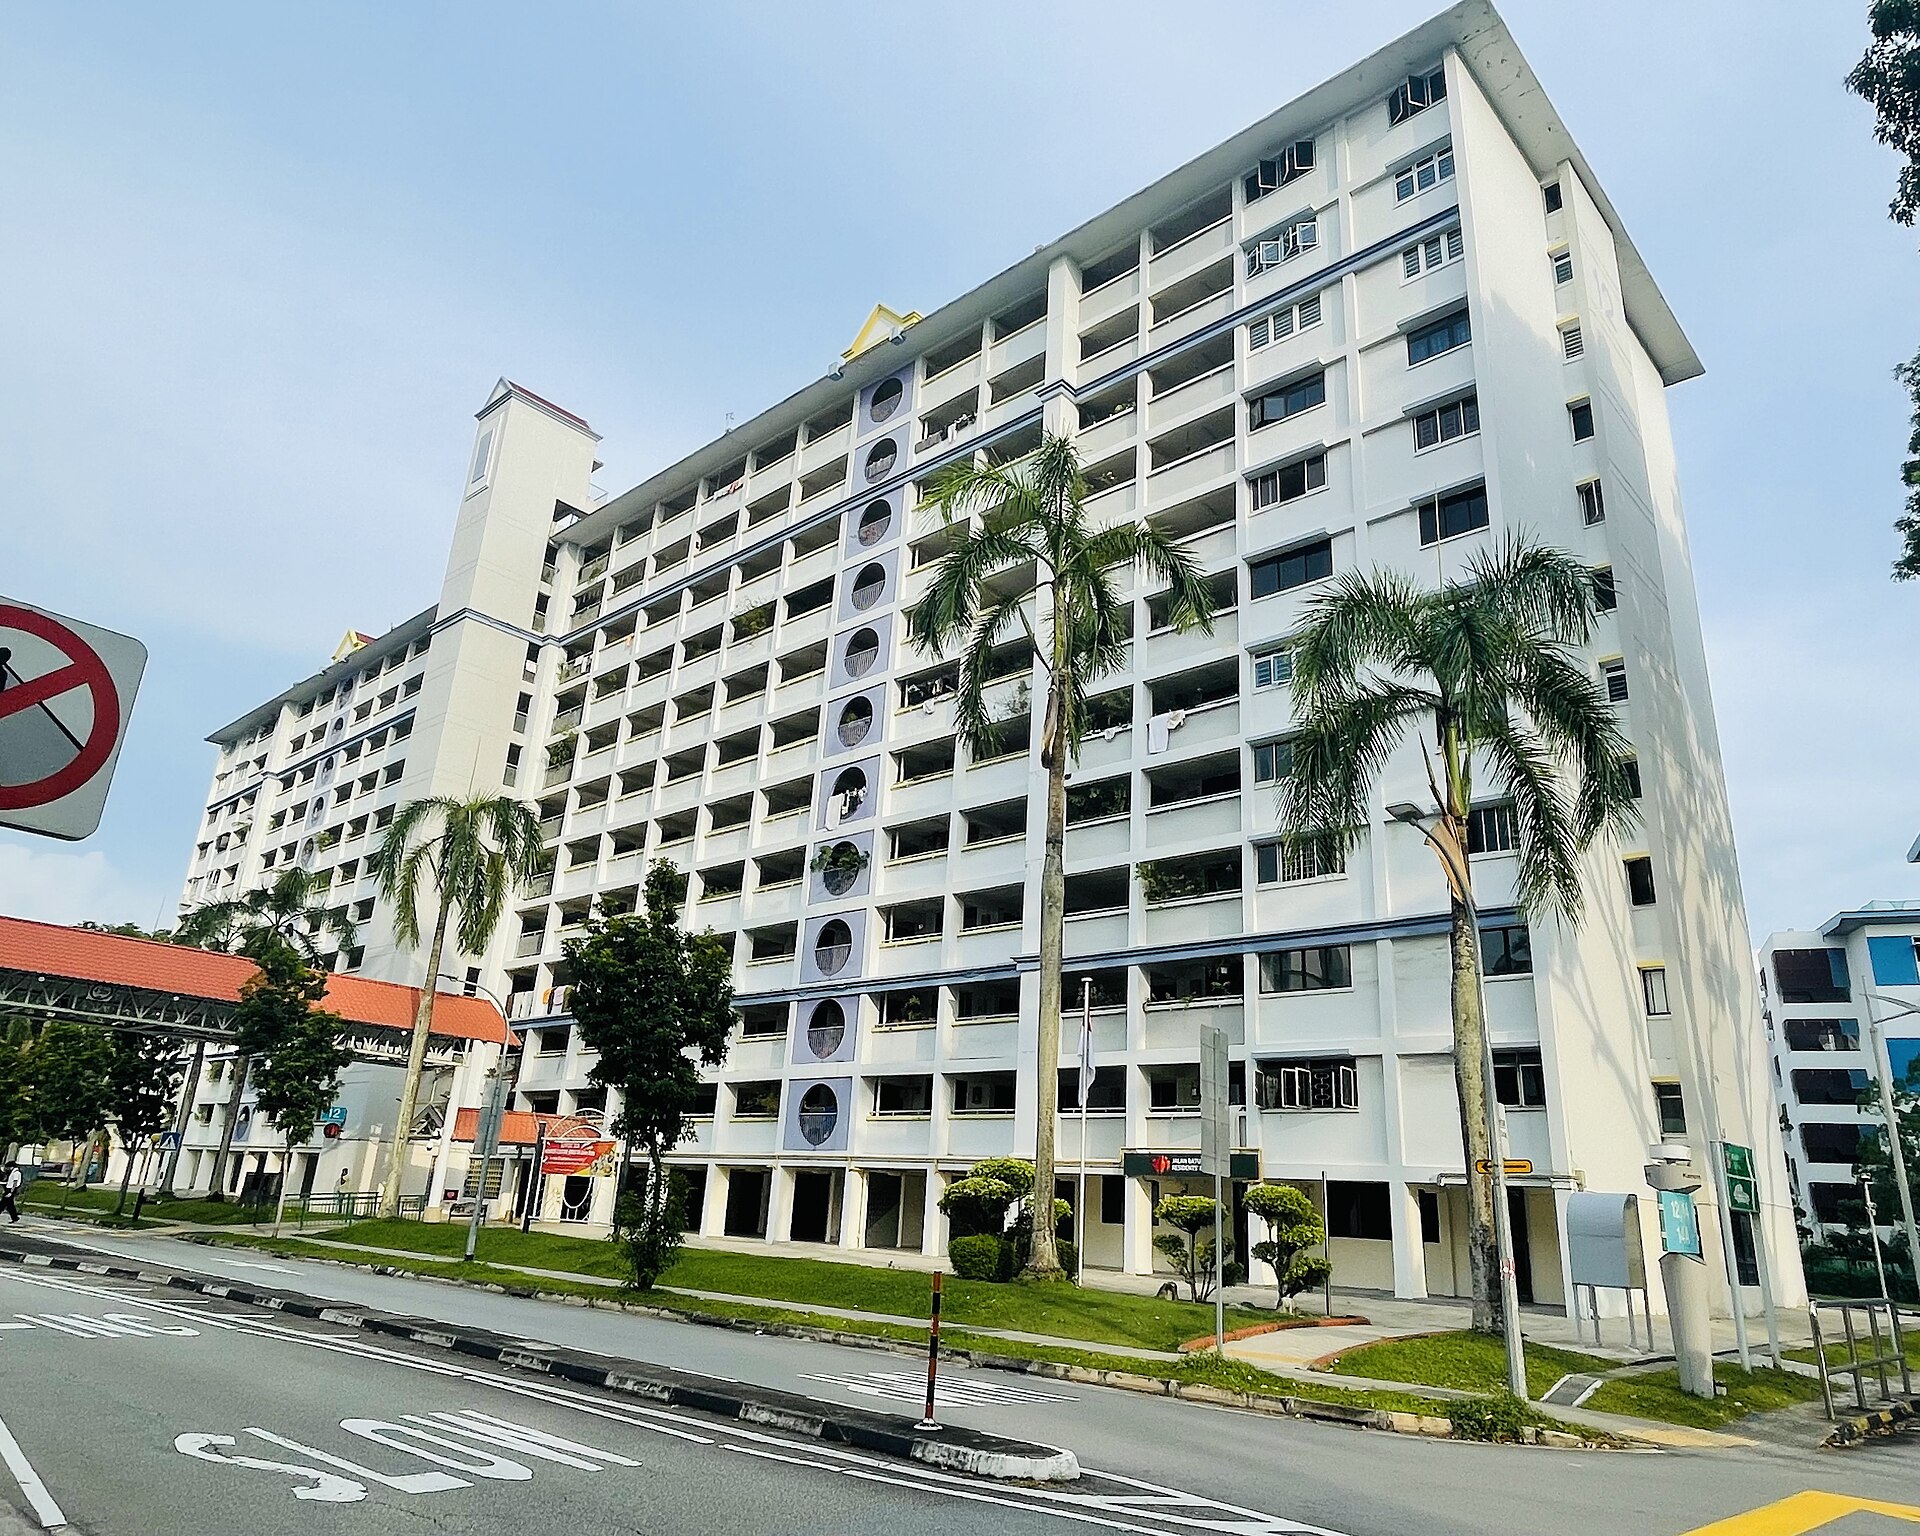
If you have been watching the Tanjong Rhu and Meyer stretch of District 15, Arina East Residences is one of the freehold launches shaping the numbers there. Its caveats also give a reading on what buyers have paid nearby.
In this article, we look at the project's developer sales month by month, the split by unit size, resale prices within 1 km, and how other District 15 launches have sold over the past year.
Arina East Residences has recorded 79 developer sales since June 2025, 17 of them in the three months to September 2026, at an overall median of S$2,877 psf. The figures here come from URA Data Service caveats and are indicative, not valuations.
How Have Monthly Sales And Prices Moved?
Sales have come in uneven bursts since the June 2025 start. The table and chart below set out caveats, the running total and the median psf for each month.
The table shows the busiest month was April 2026 with 13 caveats. January 2026 and March 2026 followed with nine and 10. Several months recorded just one caveat, and no caveats were lodged in December 2025 or June 2026.
On price, the median psf moved -0.6% from the first month, S$2,962 psf, to September 2026, S$2,943 psf. The monthly medians sit between S$2,747 psf in August 2026 and S$3,024 psf in May 2026. Note that months with one to three caveats can swing on the mix of units sold.
| Month | Caveats | Cumulative | Median psf |
|---|---|---|---|
| June 2025 | 8 | 8 | S$2,962 psf |
| July 2025 | 1 | 9 | S$3,007 psf |
| August 2025 | 1 | 10 | S$2,975 psf |
| September 2025 | 2 | 12 | S$3,006 psf |
| October 2025 | 8 | 20 | S$2,854 psf |
| November 2025 | 1 | 21 | S$2,799 psf |
| January 2026 | 9 | 30 | S$2,775 psf |
| February 2026 | 6 | 36 | S$2,883 psf |
| March 2026 | 10 | 46 | S$2,808 psf |
| April 2026 | 13 | 59 | S$2,877 psf |
| May 2026 | 3 | 62 | S$3,024 psf |
| July 2026 | 5 | 67 | S$2,773 psf |
| August 2026 | 9 | 76 | S$2,747 psf |
| September 2026 | 3 | 79 | S$2,943 psf |
Which Unit Sizes Sold Most?
Caveats also record floor area, so the sales split cleanly by size band. The table below groups the 79 sales.
Units of 70 to 89 sqm were the most sold band, with 24 caveats at a median of S$2,342,628, or S$2,925 psf. The 90 to 119 sqm band was close behind at 23 caveats, with a median price of S$3,220,000 and the highest band median of S$2,943 psf.
At the smaller end, 13 caveats under 50 sqm had a median of S$1,301,000 at S$2,628 psf. The largest band, 120 sqm and above, recorded eight caveats at a median of S$3,918,000, with a median of S$2,786 psf.
| Size band | Caveats | Median area | Median price | Median psf |
|---|---|---|---|---|
| under 50 sqm | 13 | 495 sqft | S$1,301,000 | S$2,628 psf |
| 50 to 69 sqm | 11 | 678 sqft | S$1,958,000 | S$2,887 psf |
| 70 to 89 sqm | 24 | 797 sqft | S$2,342,629 | S$2,925 psf |
| 90 to 119 sqm | 23 | 1,087 sqft | S$3,220,000 | S$2,943 psf |
| 120 sqm and above | 8 | 1,389 sqft | S$3,918,000 | S$2,786 psf |
How Does It Compare With Resales Nearby?
Within 1,000 m, 248 resales across 43 completed projects over the 24 months to September 2026 had a median of S$2,221 psf. The launch median is +29.5% against that figure.
The table below lists the nearest projects by resale count.
Waterbank At Dakota logged the most resales at 31, with a median of S$2,119 psf. Meyer Mansion, 820 m away, had the highest median in the table at S$2,899 psf across 14 resales. The closest projects are Fulcrum at 126 m, with a median of S$2,232 psf, and The Line @ Tanjong Rhu at 145 m, at S$2,363 psf. These are completed homes, so age and tenure differ from a new launch.
| Project | Tenure | TOP | Distance | Resales | Median psf |
|---|---|---|---|---|---|
| Waterbank At Dakota | 99-year leasehold | — | 937 m | 31 | S$2,119 psf |
| The Waterside | freehold | — | 384 m | 21 | S$2,219 psf |
| Dakota Residences | 99-year leasehold | — | 793 m | 18 | S$1,956 psf |
| The Seafront On Meyer | freehold | — | 481 m | 18 | S$2,420 psf |
| The Line @ Tanjong Rhu | freehold | — | 145 m | 16 | S$2,363 psf |
| Meyer Mansion | freehold | — | 820 m | 14 | S$2,899 psf |
| 8m Residences | freehold | — | 478 m | 12 | S$2,345 psf |
| Fulcrum | freehold | — | 126 m | 11 | S$2,232 psf |
What Are Other District 15 Launches Doing?
Arina East Residences is not the only project selling in the district. The table below covers developer sales over the 12 months to September 2026.
The Continuum sold the most with 180 caveats at a median of S$2,795 psf, followed by Grand Dunman with 63 caveats at S$2,514 psf. Both medians sit below the Arina East Residences figure of S$2,877 psf.
Higher medians came from smaller counts. Meyer Blue recorded 20 caveats at S$3,170 psf, and Amber House 28 caveats at S$3,104 psf. At the other end, Tembusu Grand logged seven caveats at S$2,704 psf.
| Project | Tenure | Expected TOP | Caveats | Median psf |
|---|---|---|---|---|
| The Continuum | freehold | — | 180 | S$2,795 psf |
| Grand Dunman | 99-year leasehold | — | 63 | S$2,514 psf |
| Amber House | freehold | — | 28 | S$3,104 psf |
| Meyer Blue | freehold | 2,028 | 20 | S$3,170 psf |
| Verdé Joo Chiat | freehold | — | 18 | S$2,440 psf |
| Ardor Residence | freehold | — | 12 | S$2,558 psf |
| Claydence | freehold | — | 8 | S$2,526 psf |
| Tembusu Grand | 99-year leasehold | — | 7 | S$2,704 psf |
Summary
Arina East Residences has 79 developer caveats since June 2025 at an overall median of S$2,877 psf, with 17 of those in the three months to September 2026. The monthly median moved -0.6% from S$2,962 psf in the first month to S$2,943 psf in September 2026. The 70 to 89 sqm band accounted for the most sales, 24 caveats at a median of S$2,342,628.
Caveat data records what buyers paid and when. It does not show unsold stock, floor level, facing or discounts, and small monthly counts can move a median on their own. The 29.5% gap to the S$2,221 psf median for resales within 1 km compares a new freehold launch with 43 completed projects of mixed age and tenure.
Method: URA caveats for developer sales ('new sale') at the project, dated to the month. Size bands by the caveated floor area. The nearby comparison is resale caveats in completed projects within one kilometre over 24 months, unadjusted for size, age or floor. Units sold is the caveat count, which lags option exercises by weeks. Private figures are from URA Data Service caveats, HDB figures from data.gov.sg resale records, both loaded weekly by this site's ingest. Medians are of the non-excluded transactions in the period named. Sales flagged by the hygiene rules (related-party transfers, bulk deals, outliers) are left out. Every figure is indicative and drawn from recorded transactions, not a formal valuation.