Amberwood At Holland sells 20 units at a median of S$3,028 psf in September 2026
Published 24 Oct 2026 · Amberwood At Holland
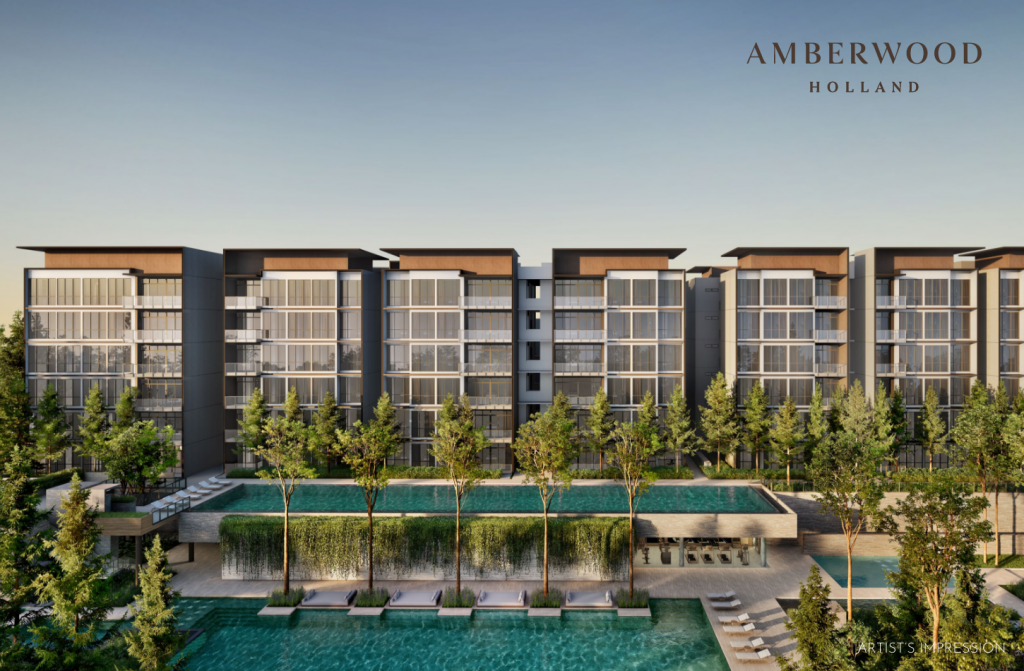
Amberwood At Holland sold 20 units in September 2026 at a median of S$3,028 psf. The 99-year leasehold project in District 10 has 212 units — the month's sales take up 9.4% of the project.
All 20 caveats were lodged in the three months to September 2026, based on caveats lodged with URA. The median psf moved 0.0% from the first month to September 2026.
All sales came in a single month
September 2026 was the busiest month, with 20 caveats. Cumulative sales stand at 20 units.
The table and chart below show the monthly count and the running median.
| Month | Caveats | Cumulative | Median psf |
|---|---|---|---|
| September 2026 | 20 | 20 | S$3,028 psf |
Units of 90 to 119 sqm were the most sold
The 90 to 119 sqm band accounted for 11 of the 20 caveats. Its median price was S$3,498,000, at a median area of 1,141 sqft.
Four units of 70 to 89 sqm sold at a median of S$2,918,000. Five units of 120 sqm and above sold at a median of S$4,520,000.
| Size band | Caveats | Median area | Median price | Median psf |
|---|---|---|---|---|
| 70 to 89 sqm | 4 | 958 sqft | S$2,918,000 | S$3,046 psf |
| 90 to 119 sqm | 11 | 1,141 sqft | S$3,498,000 | S$3,041 psf |
| 120 sqm and above | 5 | 1,496 sqft | S$4,520,000 | S$3,017 psf |
Launch median is 32.0% above nearby resales
Within 1,000 m, 286 resales across 49 completed projects over the 24 months to September 2026 had a median of S$2,293 psf. The launch median of S$3,028 psf is 32.0% above that figure.
The Cascadia recorded the most resales at 33, at a median of S$2,263 psf. The Teneriffe, the only 99-year leasehold project in the table below, had a median of S$1,144 psf across 16 resales.
| Project | Tenure | TOP | Distance | Resales | Median psf |
|---|---|---|---|---|---|
| The Cascadia | freehold | — | 662 m | 33 | S$2,263 psf |
| The Tessarina | freehold | — | 509 m | 28 | S$2,293 psf |
| Maple Woods | freehold | — | 816 m | 28 | S$2,204 psf |
| Shamrock Park | freehold | — | 940 m | 23 | S$2,588 psf |
| Ban Guan Park | freehold | — | 436 m | 22 | S$2,441 psf |
| The Teneriffe | 99-year leasehold | — | 446 m | 16 | S$1,144 psf |
| The Nexus | freehold | — | 645 m | 16 | S$2,346 psf |
| Floridian | freehold | — | 628 m | 15 | S$2,424 psf |
Skye At Holland led District 10 launch sales
Among other launches in District 10 over the 12 months to September 2026, Skye At Holland sold the most, with 606 caveats at a median of S$2,951 psf. Upperhouse At Orchard Boulevard followed with 44 caveats at S$3,497 psf.
The freehold entries in the table below sold in single digits. 21 Anderson recorded six caveats at a median of S$5,035 psf, and Park Nova four at S$5,004 psf.
| Project | Tenure | Expected TOP | Caveats | Median psf |
|---|---|---|---|---|
| Skye At Holland | 99-year leasehold | — | 606 | S$2,951 psf |
| Upperhouse At Orchard Boulevard | 99-year leasehold | — | 44 | S$3,497 psf |
| 21 Anderson | freehold | — | 6 | S$5,035 psf |
| Grange 1866 | freehold | — | 6 | S$3,270 psf |
| Park Nova | freehold | — | 4 | S$5,004 psf |
| The Giverny Residences | freehold | — | 2 | S$3,445 psf |
| Landed, Gallop Park Road | freehold | — | 1 | S$4,326 psf |
| Landed, Fernhill Road | freehold | — | 1 | S$4,067 psf |
In pictures
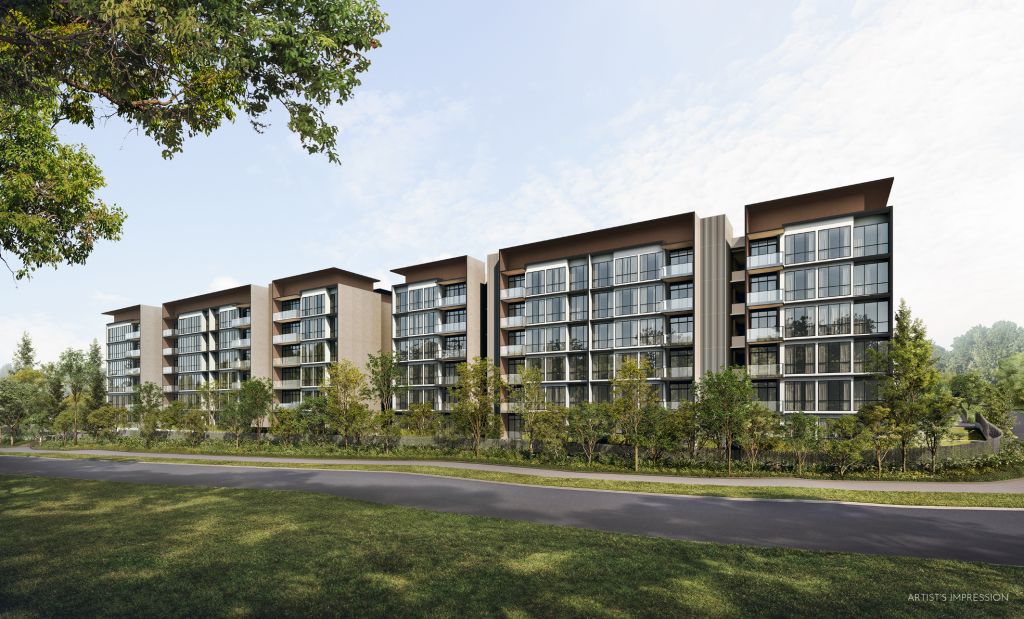
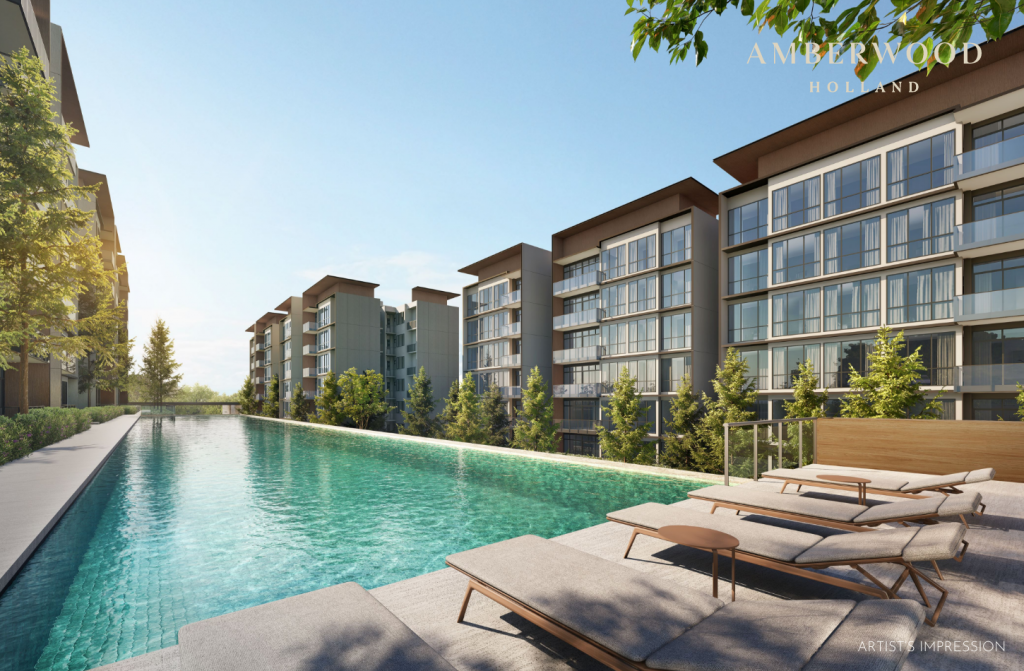
The 20 caveats represent 9.4% of the 212 units at Amberwood At Holland. All figures are indicative, drawn from recorded transactions over the periods stated.
Method: URA caveats for developer sales ('new sale') at the project, dated to the month. Size bands by the caveated floor area. The nearby comparison is resale caveats in completed projects within one kilometre over 24 months, unadjusted for size, age or floor. Units sold is the caveat count, which lags option exercises by weeks. Private figures are from URA Data Service caveats, HDB figures from data.gov.sg resale records, both loaded weekly by this site's ingest. Medians are of the non-excluded transactions in the period named. Sales flagged by the hygiene rules (related-party transfers, bulk deals, outliers) are left out. Every figure is indicative and drawn from recorded transactions, not a formal valuation.