The Minton Just Posted A Median Of S$1,690 psf In 2Q2026 — Its Highest In Eight Quarters, On Only 10 Sales
Published 9 Oct 2026 · The Minton
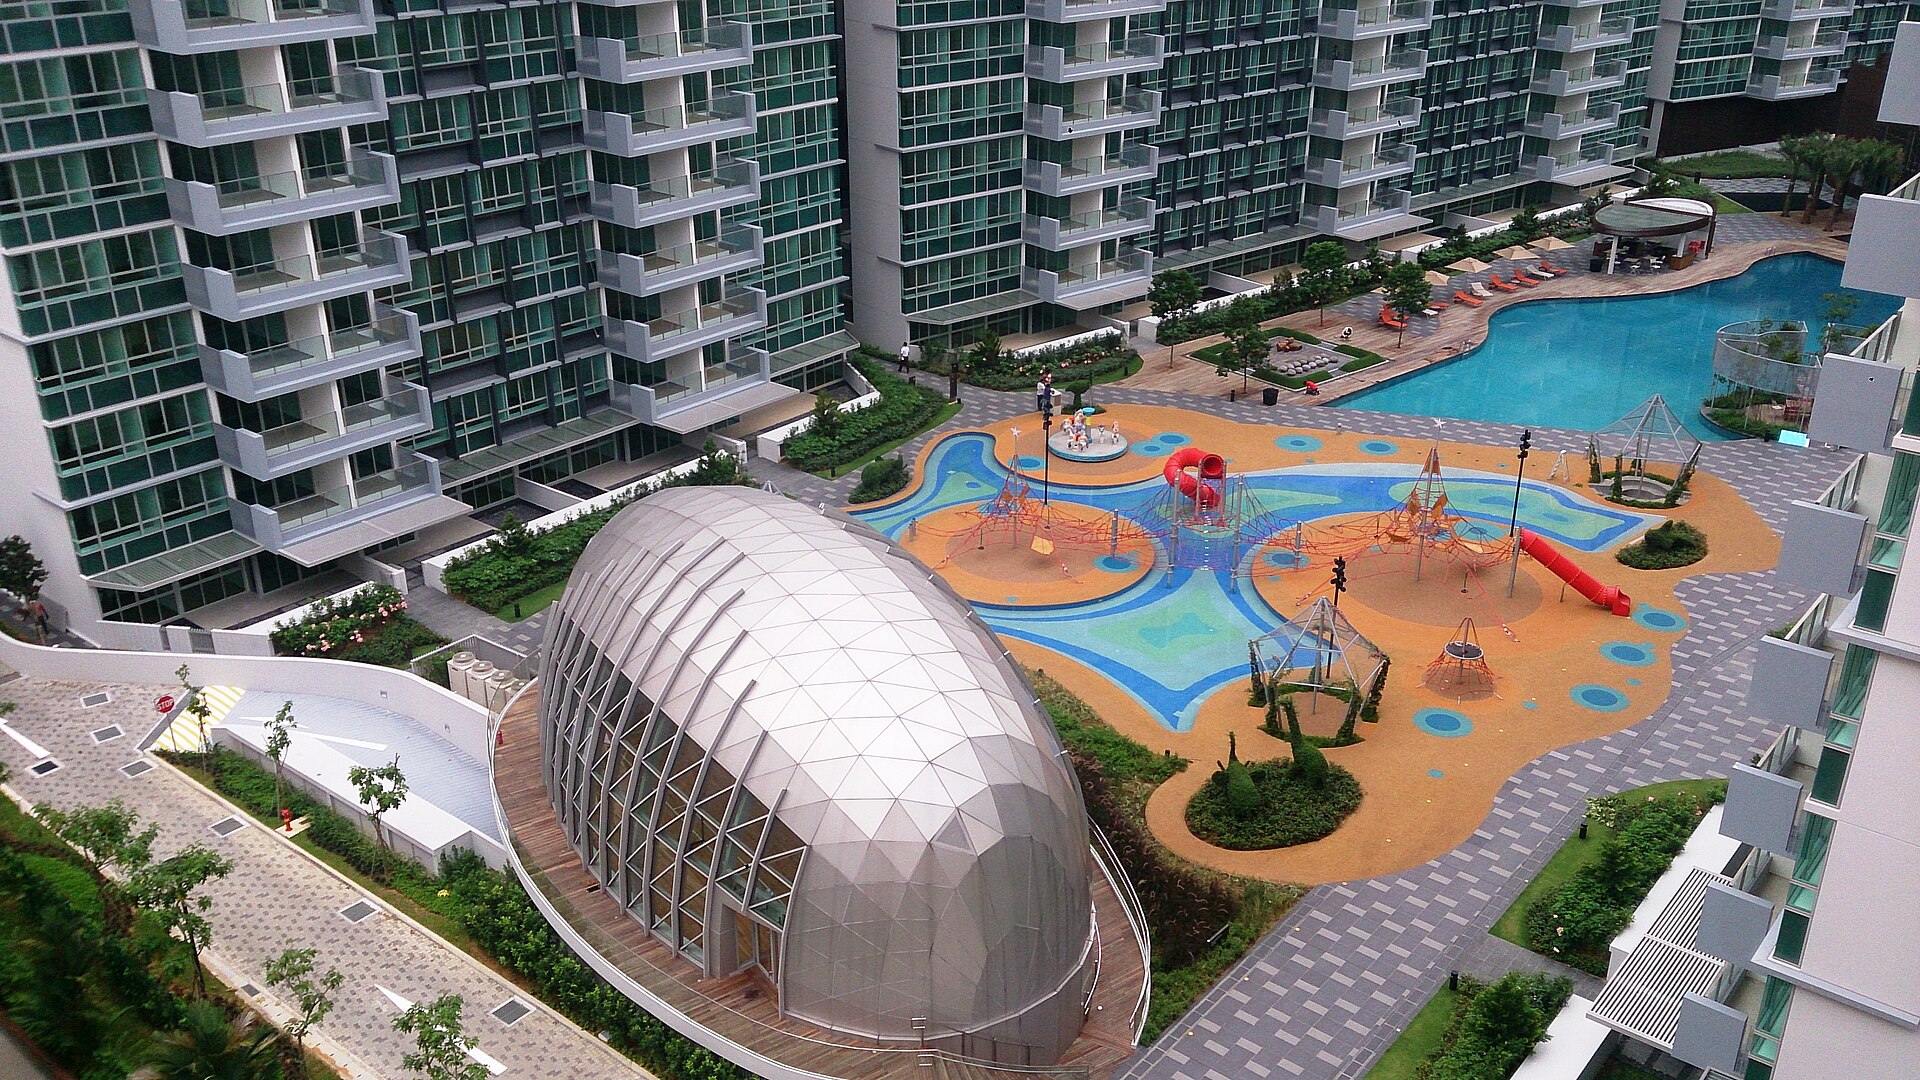
A project median can jump for two reasons. Prices moved, or the mix of units sold changed. At The Minton in 2Q2026, both explanations are still open.
According to URA Data Service caveats, The Minton recorded 41 resales over 3Q2025 to 2Q2026 at a median of S$1,575 psf. The project is a 99-year leasehold condo in District 19, with 80 years of lease left. Across the eight quarters shown, the quarterly resale median moved 13.0%, from S$1,496 psf in 3Q2024 to S$1,690 psf in 2Q2026. The latest quarter recorded 10 sales. Against the district, where the resale median was S$1,644 psf from 2,311 sales over the same four quarters, The Minton sits 4.2% below.
The quarterly median has climbed, but the latest reading comes off a thin count
The eight-quarter line is not a smooth climb. The median sat at S$1,496 psf in 3Q2024 and S$1,504 psf in 3Q2024's following quarter. It rose to S$1,574 psf in 1Q2025, then fell back to S$1,501 psf in 2Q2025. From there it ground upward through 3Q2025 and 4Q2025. The 2Q2026 figure of S$1,690 psf is the highest of the eight.
Counts matter here. 1Q2026 had only 5 resales. That is the thinnest quarter in the window. With a handful of transactions, one large high-floor unit can lift a median on its own. The 2Q2026 count of 10 is better, though still well under the 15 and 16 seen in 3Q2024 and 1Q2025.
The percentile spread adds a little texture. In 2Q2026 the 25th percentile was S$1,623 psf and the 75th was S$1,716 psf. That is a tighter band than 3Q2025, where the same two figures were S$1,468 psf and S$1,723 psf. A narrower spread in one quarter does not settle whether the mix shifted. The table and chart below show each quarter in full.
| Quarter | Resales | Median psf | 25th percentile | 75th percentile |
|---|---|---|---|---|
| Q3 2024 | 15 | S$1,496 psf | S$1,454 psf | S$1,545 psf |
| Q4 2024 | 11 | S$1,504 psf | S$1,489 psf | S$1,630 psf |
| Q1 2025 | 16 | S$1,574 psf | S$1,531 psf | S$1,714 psf |
| Q2 2025 | 11 | S$1,501 psf | S$1,455 psf | S$1,669 psf |
| Q3 2025 | 13 | S$1,528 psf | S$1,468 psf | S$1,723 psf |
| Q4 2025 | 13 | S$1,540 psf | S$1,488 psf | S$1,582 psf |
| Q1 2026 | 5 | S$1,573 psf | S$1,555 psf | S$1,628 psf |
| Q2 2026 | 10 | S$1,690 psf | S$1,623 psf | S$1,716 psf |
The three-bedroom-sized band did most of the trading, and it is not the priciest by psf
Of the 41 resales in the window, 25 fell in the 90 to 119 sqm band. Median area there was 1,087 sqft and the median price S$1,640,000, or S$1,575 psf. That band alone sets the project median for the window.
The smallest band tells a different story. The 50 to 69 sqm units recorded 7 resales at a median of S$950,000, or S$1,434 psf. That is the lowest median psf of the four bands, which runs against the usual pattern of smaller units fetching more per square foot.
At the other end, 8 resales of 120 sqm and above cleared at a median of S$2,300,444, or S$1,699 psf. The 70 to 89 sqm band had a single sale, so we would not read anything into its S$1,623 psf. The table below sets out each band.
| Size band | Resales | Median area | Median price | Median psf |
|---|---|---|---|---|
| 50 to 69 sqm | 7 | 700 sqft | S$950,000 | S$1,434 psf |
| 70 to 89 sqm | 1 | 936 sqft | S$1,520,000 | S$1,623 psf |
| 90 to 119 sqm | 25 | 1,087 sqft | S$1,640,000 | S$1,575 psf |
| 120 sqm and above | 8 | 1,335 sqft | S$2,300,444 | S$1,699 psf |
Rents have held flat for four quarters while the resale median moved
Rental approvals at The Minton have been steady. URA rental contracts show 42 in 3Q2025, 32 in 4Q2025, then 34 in each of 1Q2026 and 2Q2026. The median rent per square foot a month was 4.3 in 3Q2025 and 4.2 in each quarter after.
In dollar terms the median monthly rent was S$4,150 in 3Q2025, S$4,065 in 4Q2025, S$4,100 in 1Q2026 and S$4,150 in 2Q2026. That is a narrow range across a full year. Set the 2Q2026 median rent of S$4,150 against the resale median, and our engine measures a gross yield of about 3.2%.
Worth noting what that yield is and is not. It is a measured figure from recorded rents and recorded resale prices. It carries no deduction for maintenance, tax or vacancy. The table below shows the four quarters of contracts.
| Quarter | Contracts | Median rent (S$ psf a month) | Median monthly rent |
|---|---|---|---|
| Q3 2025 | 42 | 4.3 | S$4,150 |
| Q4 2025 | 32 | 4.2 | S$4,065 |
| Q1 2026 | 34 | 4.2 | S$4,100 |
| Q2 2026 | 34 | 4.2 | S$4,150 |
Within a kilometre, the newer leasehold projects clear well above The Minton
The neighbour table is where the gap shows up. Forest Woods, 609 m away, recorded 21 resales at a median of S$2,057 psf. Botanique At Bartley, 987 m away, had the highest count in the radius with 55 resales at S$2,008 psf. Bartley Residences logged 38 resales at S$1,798 psf.
The freehold projects nearby are smaller in volume. The Gazania recorded 9 resales at S$2,383 psf, the highest median psf in the group. Kensington Square had 8 at S$1,700 psf and Casa Cambio 7 at S$1,723 psf. Jade Residences and Space @ Kovan each recorded 6, at S$1,644 psf and S$1,664 psf.
These are project medians across different unit mixes, ages and sizes. A one-kilometre radius does not make two projects comparable. What it does show is where The Minton's S$1,575 psf window median sits among what else traded nearby. The table below lists all eight.
| Project | Tenure | TOP | Distance | Resales | Median psf |
|---|---|---|---|---|---|
| Botanique At Bartley | 99-year leasehold | — | 987 m | 55 | S$2,008 psf |
| Bartley Residences | 99-year leasehold | — | 964 m | 38 | S$1,798 psf |
| Forest Woods | 99-year leasehold | — | 609 m | 21 | S$2,057 psf |
| The Gazania | freehold | — | 773 m | 9 | S$2,383 psf |
| Kensington Square | freehold | — | 656 m | 8 | S$1,700 psf |
| Casa Cambio | freehold | — | 694 m | 7 | S$1,723 psf |
| Jade Residences | freehold | — | 527 m | 6 | S$1,644 psf |
| Space @ Kovan | freehold | — | 655 m | 6 | S$1,664 psf |
The largest transactions clustered in the 1,335 sqft and above sizes
The top five resales in the window all cleared above S$2.3M. The highest was S$2,550,000 in 4Q2025, a 1,496 sqft unit in the 11-15 storey range, at S$1,704 psf. The second was S$2,450,000 in 2Q2026, 1,453 sqft, also 11-15 storey, at S$1,686 psf.
The highest per-square-foot figure in the top five is not the highest price. A 1,335 sqft unit in the 06-10 range sold for S$2,358,000 in 2Q2026, at S$1,767 psf. Two more 1,335 sqft units in the same storey range sold in 3Q2025, at S$1,724 psf and S$1,723 psf.
Three of the five landed in 2Q2026 or 3Q2025. With 10 sales in 2Q2026, two of them above S$2.4M, the mix in that quarter leaned large. That is one reason the quarterly median and the window median differ. The table below lists them.
| Quarter | Storey range | Area | Price | Per sqft |
|---|---|---|---|---|
| Q4 2025 | 11-15 | 1,496 sqft | S$2,550,000 | S$1,704 psf |
| Q2 2026 | 11-15 | 1,453 sqft | S$2,450,000 | S$1,686 psf |
| Q2 2026 | 06-10 | 1,335 sqft | S$2,358,000 | S$1,767 psf |
| Q3 2025 | 06-10 | 1,335 sqft | S$2,300,888 | S$1,724 psf |
| Q3 2025 | 06-10 | 1,335 sqft | S$2,300,000 | S$1,723 psf |
Our own estimate at The Minton has a median error of 4.5% against later sales
We test the estimate against transactions that happened after it was produced. At The Minton, as of 4Q2025, we checked it against 29 later sales. The median error came out at 4.5%, and 31% of those sales landed inside the stated range.
That second figure is the one we watch. A median error under 5% reads well on a project with this much turnover. But fewer than a third of sales falling inside the range tells you the range is narrow relative to how much individual units vary here. Floor, stack and facing all move a price at a development of this size.
Every figure in this piece is indicative and comes from recorded transactions. None of it is a valuation of any particular home.
A few things the data does not settle. We cannot tell from these tables whether the 2Q2026 median of S$1,690 psf reflects a broad shift or the size mix in a 10-sale quarter. The 1,335 sqft and larger units that traded in 2Q2026 matter to that question. The next quarter's caveats will show whether the median holds near that level once the mix turns over. Rents are the simpler series to follow: four straight quarters near S$4,150 a month, with contract counts between 32 and 42.
One quarter at one project rarely answers much by itself. The 41 sales in the window, the four rental quarters and the eight neighbouring projects all point in slightly different directions, and that is normal. What we find useful is reading the newest figure against the eight quarters behind it, rather than on its own.
Method: URA resale caveats at the project (developer sales and sub-sales excluded) by the quarter of the sale month. Size bands by caveated floor area. Rents are URA rental contracts at the project, and the gross yield is the mean of the quarterly median rents per square foot, annualised, over the four-quarter resale median per square foot, before any cost. Lease left is the tenure less the years since the lease started, as recorded. The estimate accuracy is this site's backtest: the engine run as of the quarter named, compared with the sales since. Private figures are from URA Data Service caveats, HDB figures from data.gov.sg resale records, both loaded weekly by this site's ingest. Medians are of the non-excluded transactions in the period named. Sales flagged by the hygiene rules (related-party transfers, bulk deals, outliers) are left out. Every figure is indicative and drawn from recorded transactions, not a formal valuation.