The Garden Residences By The Numbers: 44 Resales At A Median Of S$1,895 Psf (Q3 2025 To Q2 2026)
Published 17 Oct 2026 · The Garden Residences
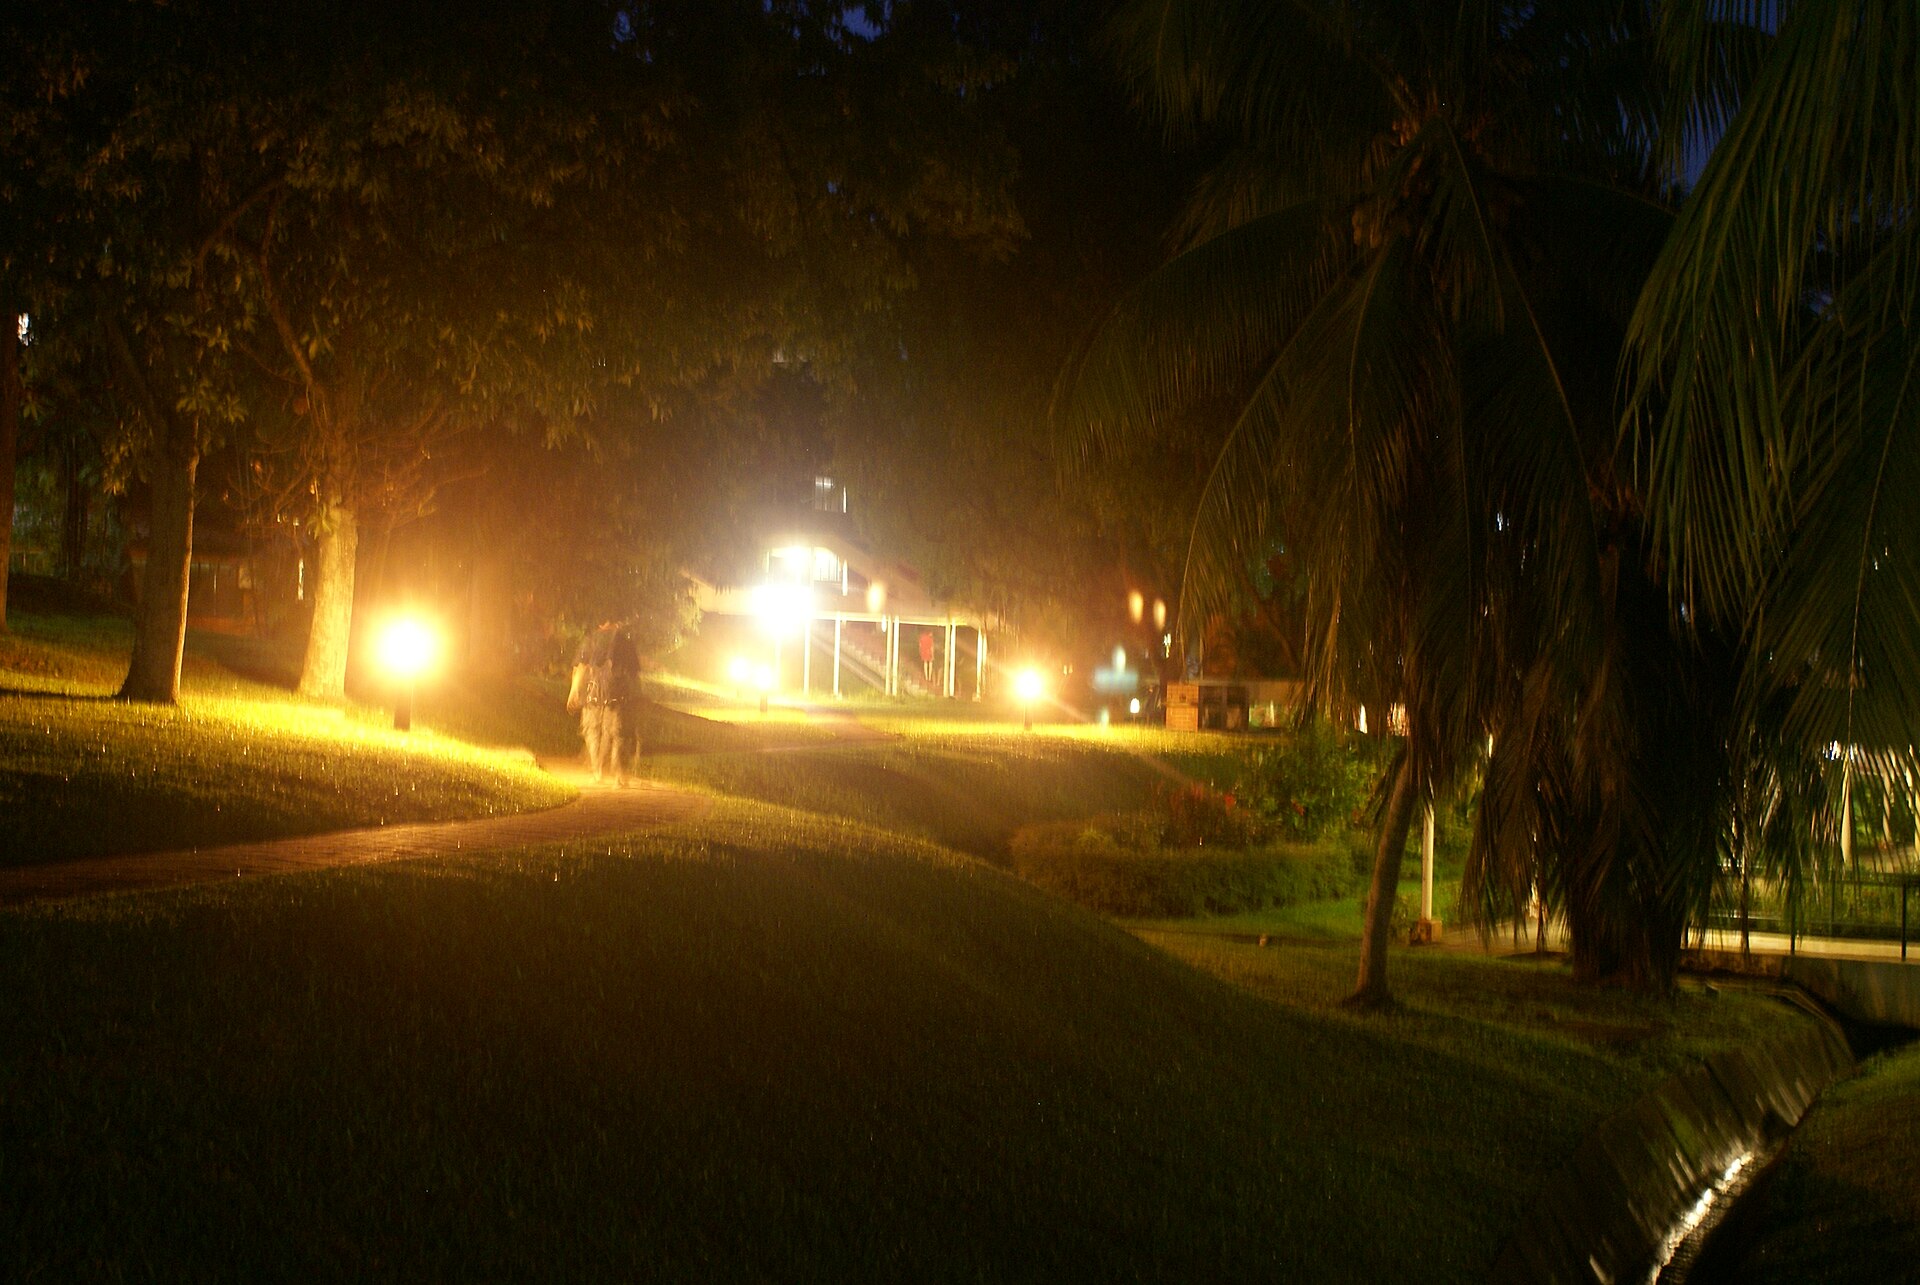
If you own, rent or are watching a unit at The Garden Residences, the recorded transactions are the clearest record of what has changed. They show what buyers paid, what tenants paid, and how the project sits against its neighbours.
In this article, we look at eight quarters of resales at the project, the prices by unit size, the rental contracts filed, the nearby projects within 1 km, and the largest sale prices recorded.
The project is a 99-year leasehold apartment development in District 19, with 90 years of lease left. It recorded 44 resales over Q3 2025 to Q2 2026 at a median of S$1,895 psf, based on URA Data Service caveats.
How Have Prices Moved Across Eight Quarters?
The quarterly median gives the shape of the move. The table and chart below cover Q3 2024 through Q2 2026.
Across the eight quarters shown, the quarterly resale median moved +4.3%. It went from S$1,829 psf in Q3 2024, on 17 sales, to S$1,908 psf in Q2 2026, on 11 sales. The softest reading was S$1,800 psf in Q1 2025.
Note that the sale counts thin out later in the window. Only four resales were recorded in Q1 2026. A median drawn from a handful of sales can swing on unit mix alone.
| Quarter | Resales | Median psf | 25th percentile | 75th percentile |
|---|---|---|---|---|
| Q3 2024 | 17 | S$1,829 psf | S$1,743 psf | S$1,847 psf |
| Q4 2024 | 24 | S$1,808 psf | S$1,780 psf | S$1,836 psf |
| Q1 2025 | 23 | S$1,800 psf | S$1,766 psf | S$1,843 psf |
| Q2 2025 | 19 | S$1,829 psf | S$1,802 psf | S$1,903 psf |
| Q3 2025 | 16 | S$1,867 psf | S$1,818 psf | S$1,914 psf |
| Q4 2025 | 13 | S$1,902 psf | S$1,877 psf | S$1,923 psf |
| Q1 2026 | 4 | S$1,893 psf | S$1,886 psf | S$1,905 psf |
| Q2 2026 | 11 | S$1,908 psf | S$1,865 psf | S$1,982 psf |
Which Unit Sizes Traded Most?
Size explains a lot of the spread in prices at any one project. The table below splits the 44 resales by floor area.
Units of 70 to 89 sqm were the most traded size. There were 20 resales at a median of S$1,489,000, or S$1,880 psf. The 50 to 69 sqm band followed with 15 resales at a median of S$1,170,000.
The larger bands show higher psf. The 90 to 119 sqm band recorded a median of S$2,004 psf across four resales. Counts that small are worth reading with care.
| Size band | Resales | Median area | Median price | Median psf |
|---|---|---|---|---|
| under 50 sqm | 2 | 484 sqft | S$877,500 | S$1,813 psf |
| 50 to 69 sqm | 15 | 614 sqft | S$1,170,000 | S$1,891 psf |
| 70 to 89 sqm | 20 | 797 sqft | S$1,489,000 | S$1,880 psf |
| 90 to 119 sqm | 4 | 1,195 sqft | S$2,394,000 | S$2,004 psf |
| 120 sqm and above | 3 | 1,539 sqft | S$3,050,000 | S$1,982 psf |
What Are Rents And The Gross Yield?
Rental contracts at the project are filed with URA, and they are listed quarterly below.
In Q2 2026, 18 contracts were filed at a median of S$5.59 psf a month. The median monthly rent was S$3,050. Measured against the resale median, that works out to a gross yield of about 3.5%.
Contract counts fell across the four quarters, from 32 in Q3 2025 to 18 in Q2 2026. The median rent stayed in a narrow band over that stretch.
| Quarter | Contracts | Median rent (S$ psf a month) | Median monthly rent |
|---|---|---|---|
| Q3 2025 | 32 | 5.4 | S$3,125 |
| Q4 2025 | 29 | 5.7 | S$3,000 |
| Q1 2026 | 24 | 5.6 | S$3,075 |
| Q2 2026 | 18 | 5.6 | S$3,050 |
How Does It Compare Within District 19 And Nearby?
The district gives one benchmark, and the projects within walking distance give another. The table below lists resales within 1 km over the same four quarters.
Over Q3 2025 to Q2 2026, the District 19 resale median was S$1,644 psf from 2,311 sales. The Garden Residences sits 15.3% above that figure.
Among the neighbours, Serangoon Garden Estate recorded 87 resales at S$2,039 psf, and Affinity At Serangoon recorded 88 at S$1,853 psf. Tenure and property type differ across these projects, so the medians are not like for like.
| Project | Tenure | TOP | Distance | Resales | Median psf |
|---|---|---|---|---|---|
| Affinity At Serangoon | 99-year leasehold | — | 341 m | 88 | S$1,853 psf |
| Serangoon Garden Estate | 999-year leasehold | — | 131 m | 87 | S$2,039 psf |
| Terrasse | 99-year leasehold | — | 856 m | 19 | S$1,572 psf |
| The Waterline | freehold | — | 726 m | 6 | S$1,470 psf |
| Haus@Serangoon Garden | 99-year leasehold | — | 986 m | 6 | S$2,155 psf |
| Kensington Park Condominium | 999-year leasehold | — | 142 m | 5 | S$1,720 psf |
| Nouvelle Park | freehold | — | 839 m | 4 | S$1,346 psf |
| Verdana Villas | freehold | — | 802 m | 4 | S$975 psf |
The Largest Sale Prices Recorded
Caveats also show the top end of the price range at the project. The table below lists the five highest resale prices in the window.
The highest was S$3,100,000 in Q2 2026, for a 1,539 sqft unit on the 11th to 15th storey, at S$2,014 psf. Three of the five largest prices were for units of that same size.
On a psf basis the ranking differs. A 1,195 sqft unit sold in Q4 2025 at S$2,076 psf, the highest per-sqft figure in the table.
| Quarter | Storey range | Area | Price | Per sqft |
|---|---|---|---|---|
| Q2 2026 | 11-15 | 1,539 sqft | S$3,100,000 | S$2,014 psf |
| Q2 2026 | 01-05 | 1,539 sqft | S$3,050,000 | S$1,982 psf |
| Q3 2025 | 06-10 | 1,539 sqft | S$3,000,000 | S$1,949 psf |
| Q4 2025 | 06-10 | 1,195 sqft | S$2,480,000 | S$2,076 psf |
| Q2 2026 | 01-05 | 1,195 sqft | S$2,420,000 | S$2,025 psf |
How Accurate Has Our Estimate Been Here?
Our own engine produces an indicative estimate for units at the project, and we test it against sales recorded afterwards.
As of Q4 2025, the estimate was tested against 33 later sales at The Garden Residences. The median error was 1.8%, and 64% of those sales fell inside the stated range. These are indicative figures from recorded transactions, not a valuation of any home.
Summary
The Garden Residences recorded 44 resales over Q3 2025 to Q2 2026. The median was S$1,895 psf. Across eight quarters, the quarterly median moved 4.3%, from S$1,829 psf to S$1,908 psf. Units of 70 to 89 sqm were the most traded band. On the rental side, 18 contracts were filed in Q2 2026 at a median of S$3,050 a month, a gross yield of about 3.5%.
These figures come from URA Data Service caveats and rental contracts, plus our own engine for the yield. They record what was transacted and filed. They do not cover unit condition, floor level beyond the bands shown, renovation, or facing. Quarters with only a few sales, such as Q1 2026, say little on their own.
Method: URA resale caveats at the project (developer sales and sub-sales excluded) by the quarter of the sale month. Size bands by caveated floor area. Rents are URA rental contracts at the project, and the gross yield is the mean of the quarterly median rents per square foot, annualised, over the four-quarter resale median per square foot, before any cost. Lease left is the tenure less the years since the lease started, as recorded. The estimate accuracy is this site's backtest: the engine run as of the quarter named, compared with the sales since. Private figures are from URA Data Service caveats, HDB figures from data.gov.sg resale records, both loaded weekly by this site's ingest. Medians are of the non-excluded transactions in the period named. Sales flagged by the hygiene rules (related-party transfers, bulk deals, outliers) are left out. Every figure is indicative and drawn from recorded transactions, not a formal valuation.