Sol Acres Resale Prices: What Q3 2026 Data Shows (Median S$1,537 psf)
Published 16 Nov 2026 · Sol Acres
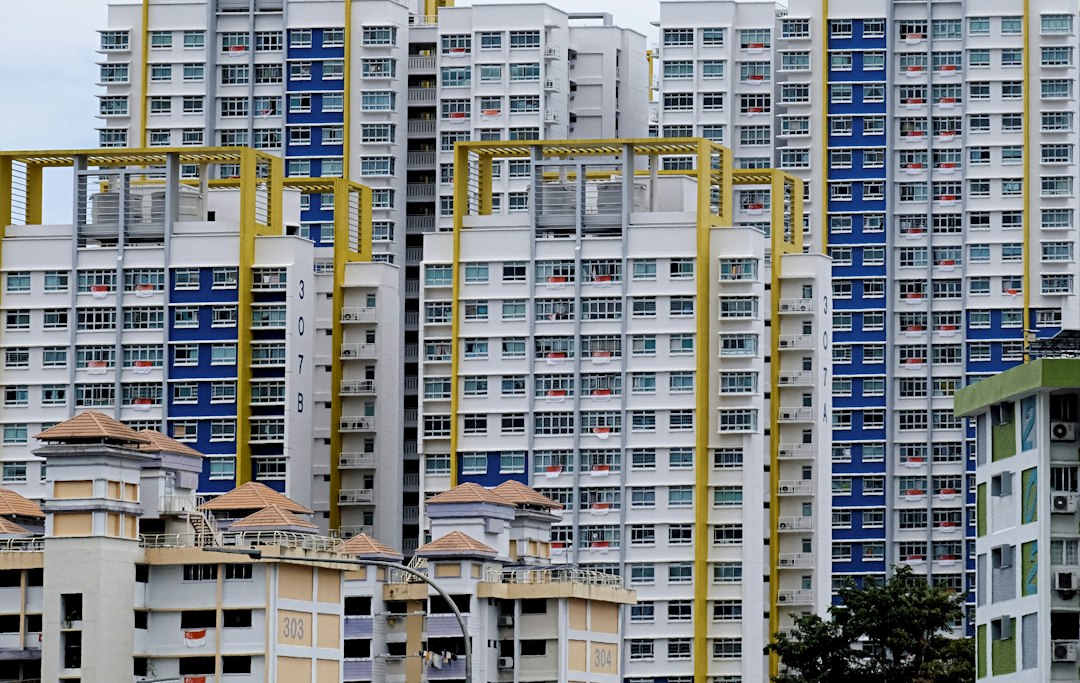
If you own a unit at Sol Acres, rent one or are simply watching the project, it helps to see how recent sales and rents have actually looked. This guide sticks to recorded transactions and leaves out opinion.
In this article, we look at eight quarters of resale prices, sales by unit size, the highest prices recorded, rental contracts and gross yield, and how Sol Acres compares with projects within 1 km and with District 23.
Sol Acres is a 99-year executive condominium in District 23, with 87 years of lease left. Based on URA Data Service records, it recorded 66 resales over Q4 2025 to Q3 2026 at a median of S$1,537 psf. All figures here are indicative and come from recorded transactions. None is a valuation of any home.
How Have Resale Prices Changed Over Eight Quarters?
The quarterly median started at S$1,467 psf in Q4 2024, from 22 sales. It reached S$1,516 psf in Q3 2026, from 20 sales. Across the eight quarters shown, that is a move of +3.3%.
The table and chart below show each quarter's median, with the 25th and 75th percentiles.
| Quarter | Resales | Median psf | 25th percentile | 75th percentile |
|---|---|---|---|---|
| Q4 2024 | 22 | S$1,467 psf | S$1,418 psf | S$1,497 psf |
| Q1 2025 | 20 | S$1,485 psf | S$1,457 psf | S$1,514 psf |
| Q2 2025 | 22 | S$1,498 psf | S$1,482 psf | S$1,541 psf |
| Q3 2025 | 15 | S$1,491 psf | S$1,479 psf | S$1,565 psf |
| Q4 2025 | 14 | S$1,512 psf | S$1,492 psf | S$1,564 psf |
| Q1 2026 | 11 | S$1,529 psf | S$1,478 psf | S$1,601 psf |
| Q2 2026 | 21 | S$1,565 psf | S$1,534 psf | S$1,593 psf |
| Q3 2026 | 20 | S$1,516 psf | S$1,486 psf | S$1,567 psf |
Which Unit Sizes Sold Most, And What Were The Highest Prices?
Units of 50 to 69 sqm were the most traded size over Q4 2025 to Q3 2026. There were 23 resales at a median of S$978,000, or S$1,543 psf. Units of 70 to 89 sqm followed with 22 resales, and units of 90 to 119 sqm had 19.
Note that the under 50 sqm band had only 2 resales, so its median of S$1,611 psf rests on very few sales. The table below sets out each size band.
The highest resale price in the window was S$1,930,000 in Q4 2025. It was for a 1,227 sqft unit in the 21-25 storey range, at S$1,573 psf. The table below lists the five highest prices. Three of them were recorded in Q2 2026.
| Size band | Resales | Median area | Median price | Median psf |
|---|---|---|---|---|
| under 50 sqm | 2 | 495 sqft | S$797,500 | S$1,611 psf |
| 50 to 69 sqm | 23 | 614 sqft | S$978,000 | S$1,543 psf |
| 70 to 89 sqm | 22 | 926 sqft | S$1,367,500 | S$1,520 psf |
| 90 to 119 sqm | 19 | 1,098 sqft | S$1,650,000 | S$1,518 psf |
| Quarter | Storey range | Area | Price | Per sqft |
|---|---|---|---|---|
| Q4 2025 | 21-25 | 1,227 sqft | S$1,930,000 | S$1,573 psf |
| Q2 2026 | 16-20 | 1,173 sqft | S$1,900,000 | S$1,619 psf |
| Q2 2026 | 11-15 | 1,163 sqft | S$1,845,000 | S$1,587 psf |
| Q2 2026 | 16-20 | 1,098 sqft | S$1,777,888 | S$1,619 psf |
| Q3 2026 | 21-25 | 1,098 sqft | S$1,777,777 | S$1,619 psf |
What Do Rents And Gross Yield Look Like?
URA rental contracts at Sol Acres in Q3 2026 numbered 39. The median rent was S$4.80 psf a month, and the median monthly rent was S$3,500. Set against the resale median, this gives a gross yield of about 3.5%, as measured by this site's engine.
The table below shows the four quarters of rental contracts. Q4 2025 had the most contracts at 42. The median monthly rent was S$3,500 in three of the four quarters and S$3,600 in Q2 2026. Note that the psf figure and the monthly figure are separate medians, so they do not always move together.
| Quarter | Contracts | Median rent (S$ psf a month) | Median monthly rent |
|---|---|---|---|
| Q4 2025 | 42 | 4.5 | S$3,500 |
| Q1 2026 | 29 | 4.5 | S$3,500 |
| Q2 2026 | 20 | 4.3 | S$3,600 |
| Q3 2026 | 39 | 4.8 | S$3,500 |
How Does Sol Acres Compare With Nearby Projects And The District?
Over the same four quarters, the District 23 resale median was S$1,486 psf from 823 sales. Sol Acres sits 3.4% above that figure.
The table below lists resales within 1 km of Sol Acres, by project. Palm Gardens is the closest at 325 m and had the most resales, 24, at a median of S$1,054 psf. Among the leasehold projects, Wandervale had the highest median at S$1,596 psf, from 15 resales, and The Rainforest followed at S$1,542 psf.
The three freehold projects had the highest medians, from Pavilion Park at S$2,202 psf to Comfort Garden at S$1,863 psf. Note that they had only 6, 3 and 2 resales each. The tenure column differs across the table, so the medians do not compare like with like.
| Project | Tenure | TOP | Distance | Resales | Median psf |
|---|---|---|---|---|---|
| Palm Gardens | 99-year leasehold | — | 325 m | 24 | S$1,054 psf |
| Hillsta | 99-year leasehold | — | 632 m | 18 | S$1,377 psf |
| The Rainforest | 99-year leasehold | — | 694 m | 16 | S$1,542 psf |
| Wandervale | 99-year leasehold | — | 667 m | 15 | S$1,596 psf |
| Mi Casa | 99-year leasehold | — | 811 m | 9 | S$1,286 psf |
| Pavilion Park | freehold | — | 661 m | 6 | S$2,202 psf |
| Comfort Garden | freehold | — | 639 m | 3 | S$1,863 psf |
| Phoenix Heights | freehold | — | 936 m | 2 | S$2,030 psf |
Summary
Sol Acres recorded 66 resales over Q4 2025 to Q3 2026 at a median of S$1,537 psf. The quarterly median moved from S$1,467 psf in Q4 2024 to S$1,516 psf in Q3 2026. The 50 to 69 sqm band was the most traded, and the Q3 2026 rental median was S$3,500 a month, a gross yield of about 3.5%.
These figures describe recorded transactions and rental contracts. They do not value any single unit. This site's estimate, tested against 54 later sales at Sol Acres as of Q1 2026, had a median error of 3.0%, with 30% of sales inside the stated range. Quarters with few sales, and size bands or nearby projects with only a handful of resales, can move a median noticeably.
Method: URA resale caveats at the project (developer sales and sub-sales excluded) by the quarter of the sale month. Size bands by caveated floor area. Rents are URA rental contracts at the project, and the gross yield is the mean of the quarterly median rents per square foot, annualised, over the four-quarter resale median per square foot, before any cost. Lease left is the tenure less the years since the lease started, as recorded. The estimate accuracy is this site's backtest: the engine run as of the quarter named, compared with the sales since. Private figures are from URA Data Service caveats, HDB figures from data.gov.sg resale records, both loaded weekly by this site's ingest. Medians are of the non-excluded transactions in the period named. Sales flagged by the hygiene rules (related-party transfers, bulk deals, outliers) are left out. Every figure is indicative and drawn from recorded transactions, not a formal valuation. Facilities, layouts and photographs, where shown, are as supplied by the developer or seen on our own visit, and are not engine data.