Sims Urban Oasis Logged 61 Resales At A Median Of S$1,944 psf — But Over Eight Quarters The Line Has Barely Moved
Published 3 Oct 2026 · Sims Urban Oasis
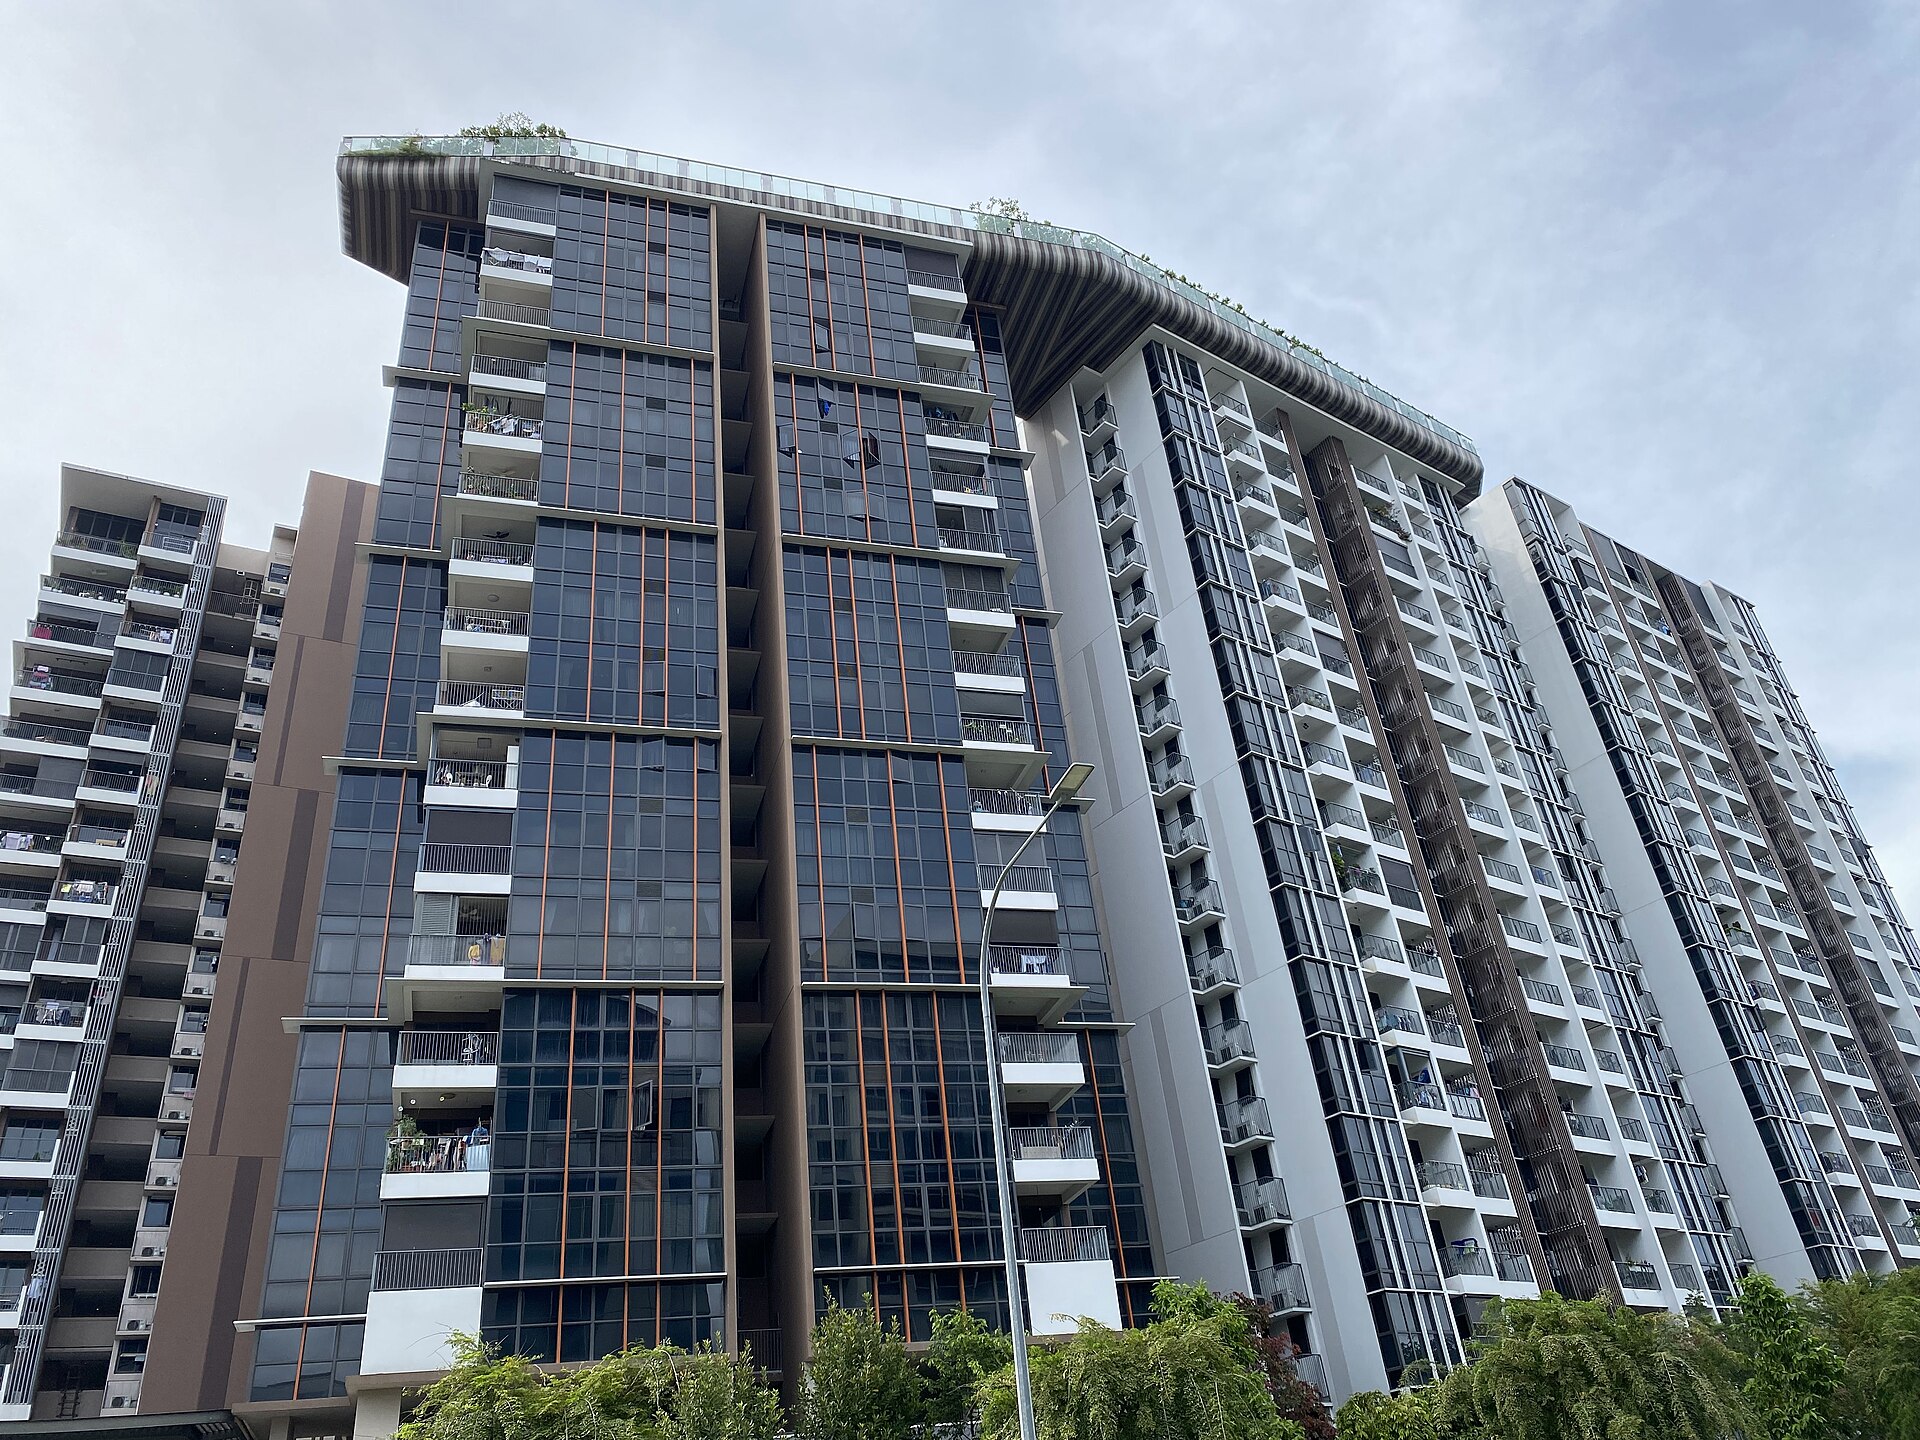
A project can be busy and flat at the same time. Sims Urban Oasis is a good example of that: plenty of transactions, and a median that keeps circling back to roughly where it started.
According to URA Data Service caveats, the 99-year leasehold project in District 14, with 87 years of lease left, recorded 61 resales over 3Q2025 to 2Q2026 at a median of S$1,944 psf. Across the eight quarters shown, the quarterly resale median moved +1.3%, from S$1,879 psf in 3Q2024 on 11 sales to S$1,903 psf in 2Q2026 on 13 sales. Over the same four-quarter window, the district's resale median was S$1,785 psf from 736 sales, putting Sims Urban Oasis +8.9% against it. We went through the quarterly table, the size bands, the rental contracts and the nearby projects. Here's what stood out to us.
The quarterly median has moved in a narrow band rather than a direction
The eight-quarter series does not trend so much as oscillate. The low point is 3Q2024 at S$1,879 psf; the high points are 1Q2026 at S$1,973 psf and 3Q2025 at S$1,972 psf. In between, quarters land between S$1,900 psf and S$1,949 psf. The most recent reading, 2Q2026, is S$1,903 psf on 13 sales, which sits near the bottom of that band. The 25th and 75th percentiles tell the same story. In 1Q2025, the spread ran from S$1,858 psf to S$1,942 psf. In 1Q2026, it ran wider, from S$1,914 psf to S$2,123 psf.
Counts matter here. Only 1Q2025 broke 20 resales, at 25. Most quarters sit between 10 and 17. With that many caveats, a handful of larger or higher-floor units can move a median by a noticeable amount without any broad shift in pricing. That is a point about measurement, not about the project. The table and the chart below show both the medians and the counts behind them, which is the safest way to read a series this size.
| Quarter | Resales | Median psf | 25th percentile | 75th percentile |
|---|---|---|---|---|
| Q3 2024 | 11 | S$1,879 psf | S$1,863 psf | S$1,939 psf |
| Q4 2024 | 10 | S$1,917 psf | S$1,856 psf | S$1,994 psf |
| Q1 2025 | 25 | S$1,900 psf | S$1,858 psf | S$1,942 psf |
| Q2 2025 | 15 | S$1,949 psf | S$1,905 psf | S$1,983 psf |
| Q3 2025 | 15 | S$1,972 psf | S$1,901 psf | S$2,061 psf |
| Q4 2025 | 17 | S$1,926 psf | S$1,899 psf | S$1,993 psf |
| Q1 2026 | 16 | S$1,973 psf | S$1,914 psf | S$2,123 psf |
| Q2 2026 | 13 | S$1,903 psf | S$1,874 psf | S$1,970 psf |
The most traded size band is not the one with the highest psf
Across 3Q2025 to 2Q2026, the 50 to 69 sqm band was the busiest, with 20 resales at a median of S$1,262,500 (S$1,904 psf) on a median area of 667 sqft. That is 20 of the 61 resales in the window. The 90 to 119 sqm band came second on volume with 16 resales, and it carries the highest median psf in the table at S$2,105 psf, on a median price of S$2,155,000.
Under 50 sqm did 13 resales at a median of S$850,000 (S$1,926 psf), which is above the busiest band on a psf basis despite being the cheapest in absolute terms. The 70 to 89 sqm band recorded 10 resales at S$1,898,444 (S$1,982 psf).
The outlier is the top band. Units of 120 sqm and above recorded only two resales, at a median of S$2,670,000 (S$1,792 psf), the lowest median psf of any band. Two sales is not a reading you can lean on, and the mix of floors and stacks inside that band is unknown from the caveats. The breakdown sits below.
| Size band | Resales | Median area | Median price | Median psf |
|---|---|---|---|---|
| under 50 sqm | 13 | 441 sqft | S$850,000 | S$1,926 psf |
| 50 to 69 sqm | 20 | 667 sqft | S$1,262,500 | S$1,904 psf |
| 70 to 89 sqm | 10 | 958 sqft | S$1,898,444 | S$1,982 psf |
| 90 to 119 sqm | 16 | 1,033 sqft | S$2,155,000 | S$2,105 psf |
| 120 sqm and above | 2 | 1,491 sqft | S$2,670,000 | S$1,792 psf |
Rents have held close to S$6 psf a month across four straight quarters
Rental approvals at Sims Urban Oasis come in at volume. In 2Q2026 there were 83 contracts at a median of S$6.19 psf a month, with a median monthly rent of S$3,650. The quarter before, 1Q2026, logged 91 contracts at S$6.31 psf a month and a median rent of S$3,800. The same S$3,800 median appeared in 3Q2025, across 93 contracts at S$6.15 psf a month.
The one quarter that breaks pattern is 4Q2025. Contracts dropped to 69, the median psf rose to S$6.67 a month, yet the median monthly rent fell to S$3,500. That combination usually points to a change in the mix of unit sizes being leased in that quarter rather than a change in rates. Set the 2Q2026 rental median against the resale median, and our engine measures a gross yield of about 3.9%. That figure is computed from recorded transactions and approved rental contracts, not from any formal valuation of a home. The quarterly rental table is below.
| Quarter | Contracts | Median rent (S$ psf a month) | Median monthly rent |
|---|---|---|---|
| Q3 2025 | 93 | 6.2 | S$3,800 |
| Q4 2025 | 69 | 6.7 | S$3,500 |
| Q1 2026 | 91 | 6.3 | S$3,800 |
| Q2 2026 | 83 | 6.2 | S$3,650 |
Within 1 km, Sims Urban Oasis sits in the upper half but not at the top
Eight nearby projects recorded resales over the same four quarters. The Antares, 759 m away and on a 99-year lease, had the highest median at S$2,099 psf from 18 resales, the largest count of the group. Gems Ville, freehold and 811 m away, came next at S$1,984 psf, though on only six resales.
Below that, the spread is wide. Tre Residences, the closest at 513 m, recorded 15 resales at S$1,879 psf. Rezi 24 came in at S$1,718 psf from eight sales. At the lower end, Atrium Residences was S$1,568 psf, Simsville S$1,443 psf from 13 resales, Central Grove S$1,376 psf and Guillemard Suites S$1,366 psf.
Tenure does not sort the list cleanly here. Two freehold projects sit near the bottom, and the leasehold Antares sits at the top. Age and project size are not in this table, so it cannot settle what separates them. Several of these counts are under 10, which again limits how much weight a single median can carry. The neighbour table is below.
| Project | Tenure | TOP | Distance | Resales | Median psf |
|---|---|---|---|---|---|
| The Antares | 99-year leasehold | — | 759 m | 18 | S$2,099 psf |
| Tre Residences | 99-year leasehold | — | 513 m | 15 | S$1,879 psf |
| Simsville | 99-year leasehold | — | 922 m | 13 | S$1,443 psf |
| Central Grove | 99-year leasehold | — | 526 m | 9 | S$1,376 psf |
| Rezi 24 | freehold | — | 928 m | 8 | S$1,718 psf |
| Guillemard Suites | freehold | — | 971 m | 7 | S$1,366 psf |
| Gems Ville | freehold | — | 811 m | 6 | S$1,984 psf |
| Atrium Residences | freehold | — | 902 m | 5 | S$1,568 psf |
The largest sales are not the ones with the highest psf
The highest resale price in the window was S$2,710,000 in 3Q2025, for a 1,539 sqft unit in the 16-20 storey range. On a per-area basis that works out to S$1,761 psf, the lowest figure in the top-five table. The second-largest, a 1,442 sqft unit in 1Q2026 at S$2,630,000, came in at S$1,823 psf.
The three remaining entries are all 1,033 sqft. A 11-15 storey unit sold for S$2,300,000 in 1Q2026 at S$2,226 psf, the highest psf of the five. A 16-20 storey unit of the same size went for S$2,268,000 at S$2,195 psf in the same quarter, and a 11-15 storey unit sold for S$2,228,888 at S$2,157 psf in 3Q2025. Three of the five largest-ticket sales landed in 1Q2026, the same quarter with the widest percentile spread in the eight-quarter series. The table below lists them.
| Quarter | Storey range | Area | Price | Per sqft |
|---|---|---|---|---|
| Q3 2025 | 16-20 | 1,539 sqft | S$2,710,000 | S$1,761 psf |
| Q1 2026 | 16-20 | 1,442 sqft | S$2,630,000 | S$1,823 psf |
| Q1 2026 | 11-15 | 1,033 sqft | S$2,300,000 | S$2,226 psf |
| Q1 2026 | 16-20 | 1,033 sqft | S$2,268,000 | S$2,195 psf |
| Q3 2025 | 11-15 | 1,033 sqft | S$2,228,888 | S$2,157 psf |
Our own estimate at this project has been tested against 58 later sales
We also check how our estimate has performed at the project itself. As of 4Q2025, it was tested against 58 later resales at Sims Urban Oasis. The median error was 3.4%, and 31% of those sales fell inside the stated range.
Those two numbers say different things. The median error describes how close the central estimate landed. The share inside the range describes how often the band captured the actual price. A median error of 3.4% with under a third of sales inside the band suggests the range is narrow relative to the real spread of prices here, which the percentile columns in the quarterly table already hint at. Every figure in this piece is indicative and drawn from recorded transactions and rental approvals, never a formal valuation.
What the figures leave open is whether 2Q2026 at S$1,903 psf is a step down or just another swing inside the same band. Thirteen sales is not many, and the quarter before it printed S$1,973 psf. The rental side is the steadier series: contract counts have run between 69 and 93 a quarter, and the median psf a month has stayed close to S$6 throughout. Next quarter's caveats will show whether the 90 to 119 sqm band keeps leading on psf, and whether the 120 sqm and above band produces more than two sales to read.
One quarter's median rarely settles anything on its own, especially at a project where a dozen caveats can set the figure. What it is useful for is position: where this series sits against its own eight-quarter range, against the district's 736 sales, and against the eight projects within a kilometre. Read that way, a single number stops being a verdict and starts being a data point.
Method: URA resale caveats at the project (developer sales and sub-sales excluded) by the quarter of the sale month. Size bands by caveated floor area. Rents are URA rental contracts at the project, and the gross yield is the mean of the quarterly median rents per square foot, annualised, over the four-quarter resale median per square foot, before any cost. Lease left is the tenure less the years since the lease started, as recorded. The estimate accuracy is this site's backtest: the engine run as of the quarter named, compared with the sales since. Private figures are from URA Data Service caveats, HDB figures from data.gov.sg resale records, both loaded weekly by this site's ingest. Medians are of the non-excluded transactions in the period named. Sales flagged by the hygiene rules (related-party transfers, bulk deals, outliers) are left out. Every figure is indicative and drawn from recorded transactions, not a formal valuation.