Reflections At Keppel Bay: 59 Resales At A Median Of S$1,694 Psf — But The Quarterly Median Has Moved Just 2.3% In Eight Quarters
Published 4 Oct 2026 · Reflections At Keppel Bay
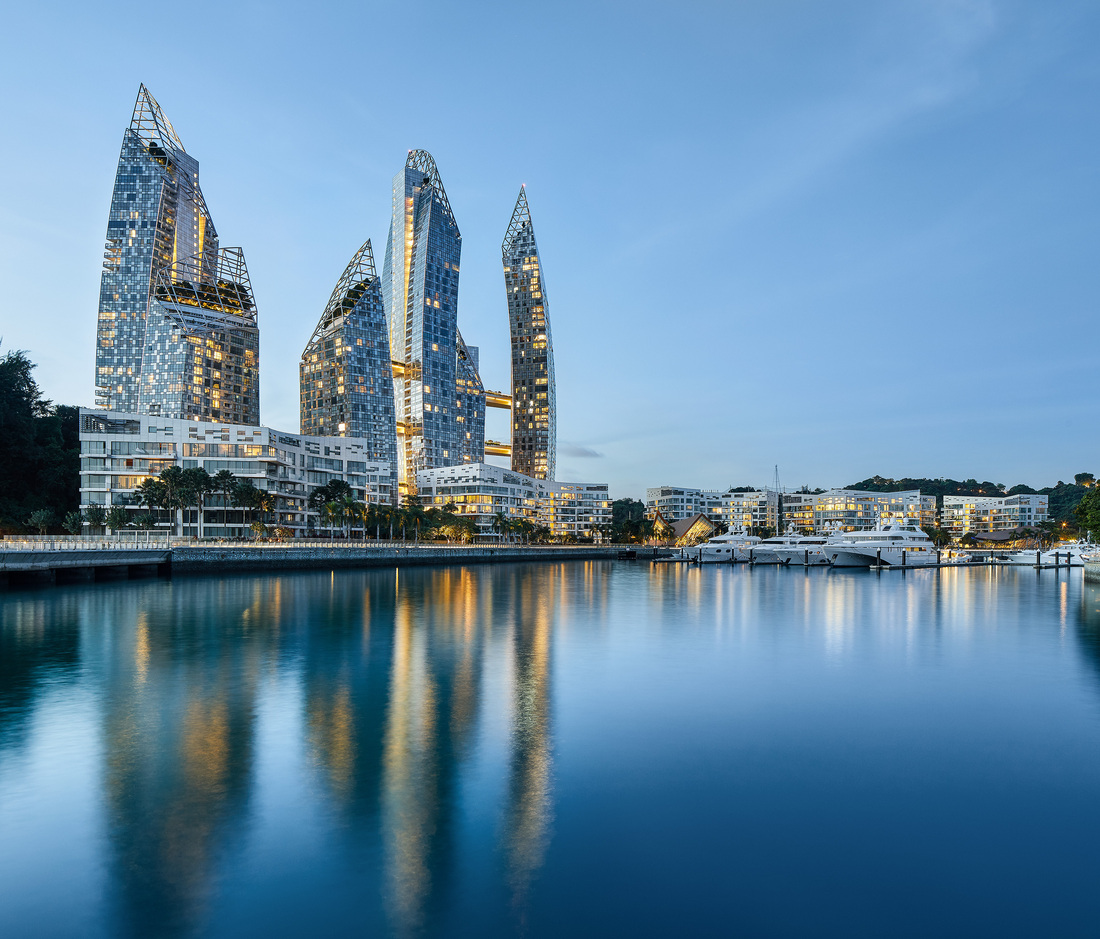
A project can look busy and still look flat. Reflections At Keppel Bay is one of those cases right now. Plenty of transactions, one very large sale, and a median that ends up close to where it started.
According to URA Data Service caveats, the project recorded 59 resales over 3Q2025 to 2Q2026 at a median of S$1,694 psf. Over the longer eight-quarter window, the quarterly resale median moved +2.3%, from S$1,703 psf in 3Q2024 on 12 sales to S$1,743 psf in 2Q2026 on 23 sales. It is a 99-year leasehold condo in District 4, with 79 years of lease left. Here is what stood out to us when we worked through the tables.
The quarterly median ends the window close to where it began, but it did not get there in a straight line
The eight-quarter change of +2.3% hides a fair amount of movement in between. The median rose to S$1,765 psf in 4Q2024, then drifted down through 2025. By 4Q2025 it sat at S$1,664 psf, the lowest reading in the window. Then 1Q2026 printed S$1,820 psf, the highest, on just 8 sales. The quarter after that, 2Q2026, came in at S$1,743 psf on 23 sales.
That 1Q2026 figure deserves a caveat. Eight transactions is a thin quarter for a project of this size. A median drawn from 8 sales can move a long way on mix alone, especially where unit sizes range widely. The quartile columns in the table below give some sense of that spread within each quarter.
Read together, the series looks range-bound rather than trending. The medians sit between S$1,664 psf and S$1,820 psf across all eight quarters. Transaction counts swing more than the prices do, from 8 in 1Q2026 to 23 in 2Q2026.
| Quarter | Resales | Median psf | 25th percentile | 75th percentile |
|---|---|---|---|---|
| Q3 2024 | 12 | S$1,703 psf | S$1,673 psf | S$1,740 psf |
| Q4 2024 | 17 | S$1,765 psf | S$1,654 psf | S$1,944 psf |
| Q1 2025 | 21 | S$1,737 psf | S$1,675 psf | S$1,975 psf |
| Q2 2025 | 15 | S$1,713 psf | S$1,680 psf | S$1,743 psf |
| Q3 2025 | 12 | S$1,683 psf | S$1,623 psf | S$1,737 psf |
| Q4 2025 | 16 | S$1,664 psf | S$1,624 psf | S$1,706 psf |
| Q1 2026 | 8 | S$1,820 psf | S$1,667 psf | S$1,903 psf |
| Q2 2026 | 23 | S$1,743 psf | S$1,668 psf | S$1,857 psf |
The largest units did most of the trading, and the smallest band barely registered
Units of 120 sqm and above were by far the most traded size over 3Q2025 to 2Q2026. That band recorded 41 resales at a median of S$2,830,000, or S$1,700 psf, on a median area of 1,668 sqft. The 90 to 119 sqm band followed with 16 resales at a median of S$1,850,000 (S$1,692 psf).
The 70 to 89 sqm band recorded 2 resales, at a median of S$1,585,000 (S$1,911 psf). Two transactions is not a band you can draw much from. We note it mainly to show how little of the activity here sits at the smaller end.
On a per-area basis the two larger bands land close together, at S$1,692 psf and S$1,700 psf. The gap between them in absolute price is much wider, which is simply what the median areas imply. This is also why the project-level median tracks the large-unit band so closely: most of the sales are in it.
| Size band | Resales | Median area | Median price | Median psf |
|---|---|---|---|---|
| 70 to 89 sqm | 2 | 834 sqft | S$1,585,000 | S$1,911 psf |
| 90 to 119 sqm | 16 | 1,114 sqft | S$1,850,000 | S$1,692 psf |
| 120 sqm and above | 41 | 1,668 sqft | S$2,830,000 | S$1,700 psf |
Rental contracts fell each quarter while the median rent dropped in the latest period
The rental side has its own pattern. Contract counts fell in each of the four quarters shown, from 96 in 3Q2025 to 82, then 61, then 52 in 2Q2026. The median rent on a per-area basis held at 5.4 psf a month for three quarters before easing to 5.3 psf a month in 2Q2026.
The median monthly rent moved more. It was S$7,725 in 3Q2025, S$8,000 in 4Q2025, S$7,500 in 1Q2026, and S$6,600 in 2Q2026. Because the per-area median barely shifted over the same stretch, the mix of unit sizes being leased is doing much of the work in that monthly figure. Rental approvals data does not tell us which units they were.
Set the 2Q2026 median rent of S$6,600 against the resale median and our engine measures a gross yield of about 3.8%. That is an indicative figure from recorded contracts and caveats, not a valuation of any unit.
| Quarter | Contracts | Median rent (S$ psf a month) | Median monthly rent |
|---|---|---|---|
| Q3 2025 | 96 | 5.4 | S$7,725 |
| Q4 2025 | 82 | 5.4 | S$8,000 |
| Q1 2026 | 61 | 5.4 | S$7,500 |
| Q2 2026 | 52 | 5.3 | S$6,600 |
The project transacts below its district and below most of its immediate neighbours
Over 3Q2025 to 2Q2026, the District 4 resale median was S$1,781 psf from 275 sales. Reflections At Keppel Bay sits -4.9% against that. Within a 1 km radius, the picture is similar. Caribbean At Keppel Bay, 401 m away and also 99-year leasehold, recorded 41 resales at a median of S$1,949 psf. Corals At Keppel Bay, at 680 m, recorded 16 resales at S$2,033 psf.
The freehold projects nearby sit higher again. Skyline Residences, 628 m away, recorded 16 resales at a median of S$2,273 psf. The Reef At King's Dock shows S$2,456 psf, but on a single resale, and The Foresta @ Mount Faber S$2,079 psf, also on one. Single-sale medians are not comparisons; they are individual transactions.
The one neighbour below is Harbour View Towers at S$1,510 psf, from 3 resales. Tenure, age and unit mix all differ across this list, and the table does not control for any of them.
| Project | Tenure | TOP | Distance | Resales | Median psf |
|---|---|---|---|---|---|
| Caribbean At Keppel Bay | 99-year leasehold | — | 401 m | 41 | S$1,949 psf |
| Skyline Residences | freehold | — | 628 m | 16 | S$2,273 psf |
| Corals At Keppel Bay | 99-year leasehold | — | 680 m | 16 | S$2,033 psf |
| Harbour View Towers | 99-year leasehold | — | 608 m | 3 | S$1,510 psf |
| Landed, Wishart Road | freehold | — | 473 m | 1 | S$1,498 psf |
| The Foresta @ Mount Faber | freehold | — | 517 m | 1 | S$2,079 psf |
| The Reef At King's Dock | 99-year leasehold | — | 729 m | 1 | S$2,456 psf |
One sale sits far above everything else in the window
The highest resale over the four quarters was S$19,280,000 in 2Q2026. The unit measured 8,277 sqft, in the 21-25 storey range, at S$2,329 psf. That is both the largest area and the highest per-area figure in the top-five table.
The step down from there is steep. The second-highest was S$6,400,000 in 3Q2025, a 3,993 sqft unit on the 01-05 storey range at S$1,603 psf. Third was S$5,700,000 in 2Q2026, 2,949 sqft at S$1,933 psf. Per-area figures across the five range from S$1,603 psf to S$2,329 psf, with no clean relationship to storey height in this small a set.
A sale of that size is worth keeping in view when reading the 2Q2026 median of S$1,743 psf. A median is less exposed to a single large transaction than an average, but the quarter's mix still shapes it.
| Quarter | Storey range | Area | Price | Per sqft |
|---|---|---|---|---|
| Q2 2026 | 21-25 | 8,277 sqft | S$19,280,000 | S$2,329 psf |
| Q3 2025 | 01-05 | 3,993 sqft | S$6,400,000 | S$1,603 psf |
| Q2 2026 | 01-05 | 2,949 sqft | S$5,700,000 | S$1,933 psf |
| Q3 2025 | 06-10 | 2,659 sqft | S$4,320,000 | S$1,625 psf |
| Q2 2026 | 21-25 | 2,508 sqft | S$4,150,000 | S$1,655 psf |
Our own estimate has a measurable error here, and we publish it
Tested against 45 later sales at Reflections At Keppel Bay as of 4Q2025, this site's estimate had a median error of 5.9%. Within the stated range, 24% of those sales landed.
We show those backtest figures because the project's unit sizes vary so widely. A model that is tested on 834 sqft units and 8,277 sqft units in the same project will carry more error than one working on a uniform block. The figure is measured against recorded transactions, and it is indicative rather than a valuation.
The figures leave a few things open. Whether the 23 sales in 2Q2026 mark a steadier run of volume, or whether the count drops back toward the 8 seen in 1Q2026, the next quarter's caveats will answer. The same goes for rents: contract counts have fallen in each of the four quarters shown, and the per-area median only moved in the most recent one. We will see whether that 5.3 psf a month reading holds or returns to the 5.4 level of the three quarters before it.
One quarter of a single project rarely settles anything on its own. A median built on 8 sales, a S$19,280,000 outlier, and a -4.9% gap to the district are three different kinds of fact, and they answer different questions. What they are worth comes from reading them alongside the district, the neighbours and the eight-quarter series, which is how we have laid them out here.
Method: URA resale caveats at the project (developer sales and sub-sales excluded) by the quarter of the sale month. Size bands by caveated floor area. Rents are URA rental contracts at the project, and the gross yield is the mean of the quarterly median rents per square foot, annualised, over the four-quarter resale median per square foot, before any cost. Lease left is the tenure less the years since the lease started, as recorded. The estimate accuracy is this site's backtest: the engine run as of the quarter named, compared with the sales since. Private figures are from URA Data Service caveats, HDB figures from data.gov.sg resale records, both loaded weekly by this site's ingest. Medians are of the non-excluded transactions in the period named. Sales flagged by the hygiene rules (related-party transfers, bulk deals, outliers) are left out. Every figure is indicative and drawn from recorded transactions, not a formal valuation.