Queens Peak By The Numbers: 39 Resales At A Median Of S$2,242 psf (Q3 2025 To Q2 2026)
Published 14 Oct 2026 · Queens Peak
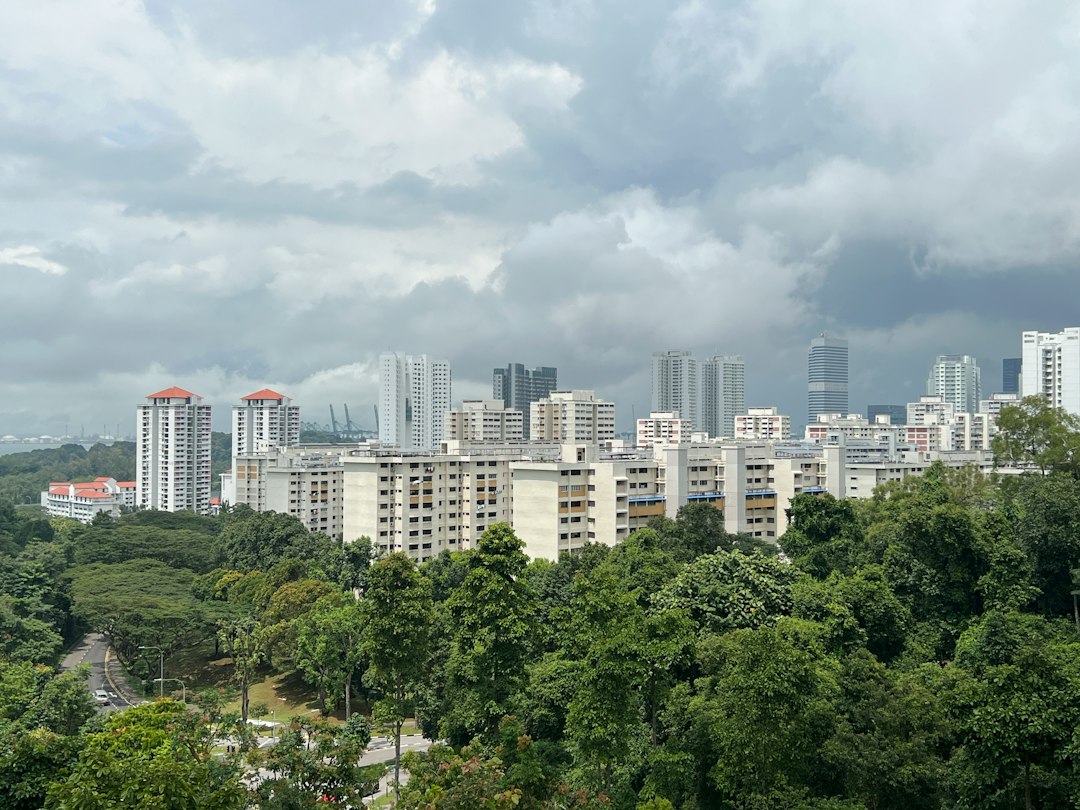
Queens Peak is a 99-year leasehold condo in District 3, with 88 years of lease left. If you own, rent or watch a unit here, recent transactions are the clearest record of what the market paid.
In this article, we look at resales by quarter, resales by unit size, the biggest sales, rental contracts and gross yield, and how nearby projects traded.
Over Q3 2025 to Q2 2026, the project recorded 39 resales at a median of S$2,242 psf. That figure comes from URA Data Service caveats, and it is indicative rather than a valuation of any home.
How Have Prices Moved Over The Past Eight Quarters?
Quarterly medians at Queens Peak have sat within a narrow band. The table and chart below show the median psf each quarter, with the 25th and 75th percentiles and the number of sales.
The median was S$2,188 psf in Q3 2024, on 7 sales. It was S$2,226 psf in Q2 2026, on 12 sales. Across the 8 quarters shown, that is a move of +1.8%.
Note the counts behind each point. Q4 2025 had just 5 resales, and Q1 2026 had 8. The Q1 2026 median of S$2,311 psf was the highest in the window. Small counts and a changing mix of units can move a median on their own.
| Quarter | Resales | Median psf | 25th percentile | 75th percentile |
|---|---|---|---|---|
| Q3 2024 | 7 | S$2,188 psf | S$2,178 psf | S$2,242 psf |
| Q4 2024 | 15 | S$2,206 psf | S$2,119 psf | S$2,258 psf |
| Q1 2025 | 11 | S$2,194 psf | S$2,162 psf | S$2,240 psf |
| Q2 2025 | 12 | S$2,216 psf | S$2,138 psf | S$2,276 psf |
| Q3 2025 | 14 | S$2,251 psf | S$2,204 psf | S$2,282 psf |
| Q4 2025 | 5 | S$2,253 psf | S$2,221 psf | S$2,275 psf |
| Q1 2026 | 8 | S$2,311 psf | S$2,186 psf | S$2,333 psf |
| Q2 2026 | 12 | S$2,226 psf | S$2,194 psf | S$2,242 psf |
Which Unit Sizes Traded Most, And What Were The Top Prices?
Unit size shapes both the price and the psf here. The two tables below break the 39 resales into size bands, then list the five highest prices over the same four quarters.
The 70 to 89 sqm band was the busiest, with 17 resales at a median of S$1,940,000, or S$2,275 psf. Units under 50 sqm followed, with 14 resales at a median of S$969,000. The 90 to 119 sqm band had the highest median psf at S$2,326 psf, but only 3 sales.
At the top end, the highest price was S$3,480,000 in Q1 2026. That was a 1,507 sqft unit in the 36-40 storey range, at S$2,309 psf. Three of the five largest deals were 1,507 sqft units, and two were 1,001 sqft.
| Size band | Resales | Median area | Median price | Median psf |
|---|---|---|---|---|
| under 50 sqm | 14 | 436 sqft | S$969,000 | S$2,219 psf |
| 50 to 69 sqm | 2 | 624 sqft | S$1,368,000 | S$2,191 psf |
| 70 to 89 sqm | 17 | 850 sqft | S$1,940,000 | S$2,275 psf |
| 90 to 119 sqm | 3 | 1,001 sqft | S$2,328,000 | S$2,326 psf |
| 120 sqm and above | 3 | 1,507 sqft | S$3,460,000 | S$2,296 psf |
| Quarter | Storey range | Area | Price | Per sqft |
|---|---|---|---|---|
| Q1 2026 | 36-40 | 1,507 sqft | S$3,480,000 | S$2,309 psf |
| Q3 2025 | 36-40 | 1,507 sqft | S$3,460,000 | S$2,296 psf |
| Q2 2026 | 31-35 | 1,507 sqft | S$3,350,000 | S$2,223 psf |
| Q2 2026 | 31-35 | 1,001 sqft | S$2,338,000 | S$2,336 psf |
| Q1 2026 | 31-35 | 1,001 sqft | S$2,328,000 | S$2,326 psf |
What Do Rents Look Like At Queens Peak?
Rental approvals give a separate read on the project. The table below shows contracts by quarter, with the median rent in psf a month and in dollars.
There were 53 contracts in Q2 2026, at a median of S$7.69 psf a month. The median monthly rent was S$3,950. Contract counts were higher earlier in the window, at 82 in Q3 2025 and 65 in Q1 2026.
Set against the resale median, our engine measures a gross yield of about 4.0%. That is a measured figure across recorded transactions, not a return on any one unit.
| Quarter | Contracts | Median rent (S$ psf a month) | Median monthly rent |
|---|---|---|---|
| Q3 2025 | 82 | 7.2 | S$4,075 |
| Q4 2025 | 57 | 7.6 | S$4,000 |
| Q1 2026 | 65 | 7.4 | S$4,200 |
| Q2 2026 | 53 | 7.7 | S$3,950 |
How Does Queens Peak Compare With Its Neighbours?
District 3 recorded 614 resales over the same four quarters, at a median of S$2,216 psf. Queens Peak sits +1.2% against that. The table below lists resales within 1 km, by project.
Stirling Residences was the busiest nearby, with 116 resales at a median of S$2,384 psf. Commonwealth Towers, 137 m away, recorded 45 resales at S$2,295 psf. The freehold projects in the list traded lower, with Alexis at S$1,883 psf on 14 sales. Note that Shepherd's Hill Estate shows the highest median at S$2,535 psf, but on only 2 sales.
Our own estimate has also been tested here. As of Q4 2025, it was checked against 31 later sales at Queens Peak. The median error was 3.0%, with 35% of sales falling inside the stated range.
| Project | Tenure | TOP | Distance | Resales | Median psf |
|---|---|---|---|---|---|
| Stirling Residences | 99-year leasehold | — | 447 m | 116 | S$2,384 psf |
| Commonwealth Towers | 99-year leasehold | — | 137 m | 45 | S$2,295 psf |
| Margaret Ville | 99-year leasehold | — | 742 m | 23 | S$2,251 psf |
| Alexis | freehold | — | 358 m | 14 | S$1,883 psf |
| Queens | 99-year leasehold | — | 189 m | 13 | S$1,842 psf |
| The Anchorage | freehold | — | 572 m | 7 | S$2,024 psf |
| Queensway Tower | freehold | — | 851 m | 3 | S$1,402 psf |
| Shepherd's Hill Estate | freehold | — | 299 m | 2 | S$2,535 psf |
Summary
Queens Peak recorded 39 resales over Q3 2025 to Q2 2026, at a median of S$2,242 psf. The quarterly median moved +1.8% across the 8 quarters shown. The most traded size band was 70 to 89 sqm, with 17 sales at a median of S$1,940,000. On the rental side, Q2 2026 brought 53 contracts at a median of S$7.69 psf a month.
These figures come from URA Data Service caveats and rental contracts, plus this site's engine for the yield and the estimate test. They record what was transacted and lodged. They do not show unit condition, renovation, facing or the terms of any single deal, and quarters with few sales carry more noise than the medians suggest.
Method: URA resale caveats at the project (developer sales and sub-sales excluded) by the quarter of the sale month. Size bands by caveated floor area. Rents are URA rental contracts at the project, and the gross yield is the mean of the quarterly median rents per square foot, annualised, over the four-quarter resale median per square foot, before any cost. Lease left is the tenure less the years since the lease started, as recorded. The estimate accuracy is this site's backtest: the engine run as of the quarter named, compared with the sales since. Private figures are from URA Data Service caveats, HDB figures from data.gov.sg resale records, both loaded weekly by this site's ingest. Medians are of the non-excluded transactions in the period named. Sales flagged by the hygiene rules (related-party transfers, bulk deals, outliers) are left out. Every figure is indicative and drawn from recorded transactions, not a formal valuation.