Parc Botannia's Median Psf Has Moved Just 1.7% In Eight Quarters — But Its 980 Sqft Units Are Clearing At S$1,787 psf
Published 19 Oct 2026 · Parc Botannia
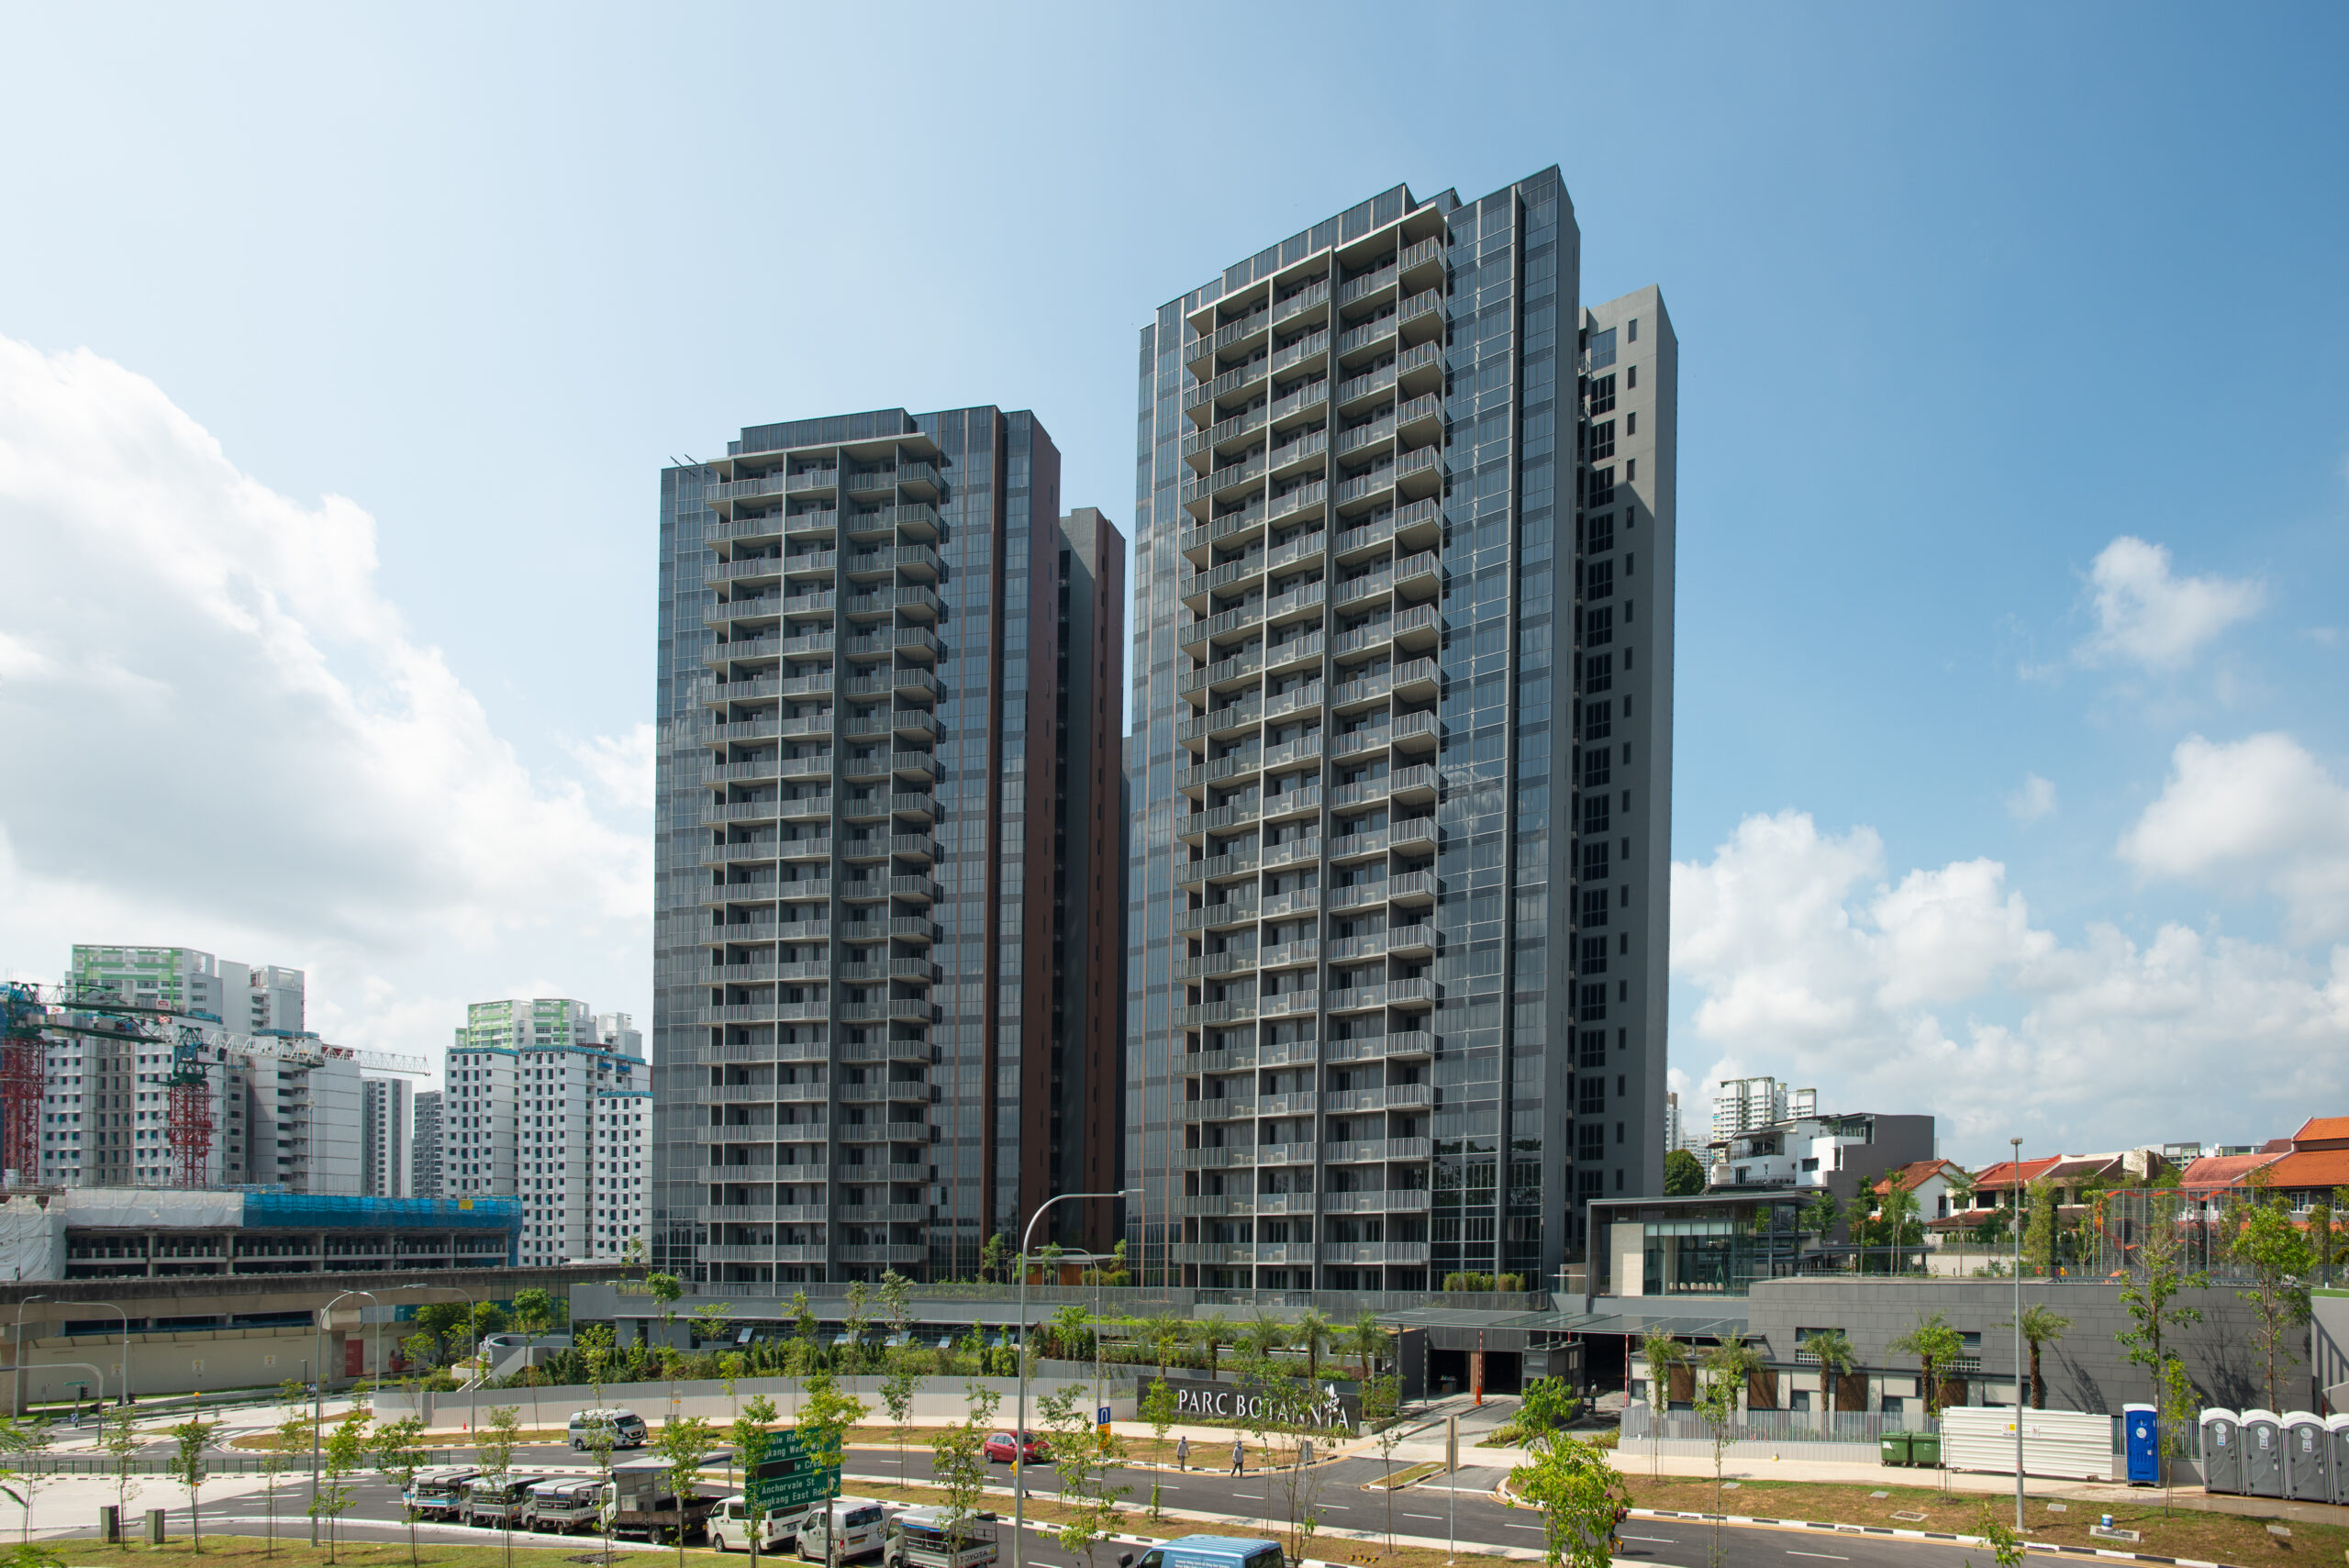
Some projects tell a clean story over two years. Parc Botannia is not one of them. The quarterly median has gone up, come back down, and ended up close to where it began. Underneath that flat line, the size bands are not behaving the same way at all.
According to URA Data Service caveats, Parc Botannia recorded 39 resales over 3Q2025 to 2Q2026 at a median of S$1,654 psf. Across the eight quarters shown, the quarterly median moved +1.7%, from S$1,628 psf in 3Q2024 on 14 sales to S$1,656 psf in 2Q2026 on 10 sales. It is a 99-year leasehold condo in District 28, with 89 years of lease left. Over the same four-quarter window, the district's resale median was S$1,544 psf from 452 sales, which puts Parc Botannia +7.2% against it.
Eight quarters on, the median has ended up almost exactly where it started
The line below is less a trend than a wobble. The high point sits at 3Q2025, with a median of S$1,714 psf across 12 sales. The low point comes two quarters later, at S$1,611 psf in 1Q2026 across 11 sales. In between, 4Q2025 printed S$1,673 psf. Then 2Q2026 came back up again. Over the full stretch, the net move is +1.7%.
Sales counts matter here, and they are small. 4Q2025 has just 6 resales behind its median. 4Q2024 has 23, the fattest quarter in the table. A median built on six deals can shift on one high floor or one compact unit. The chart cannot separate a genuine price move from a change in what happened to transact.
The quartile columns give a sense of the spread. In 2Q2026 they sit at S$1,630 psf and S$1,725 psf. In 4Q2024 they sat at S$1,571 psf and S$1,635 psf. The band has shifted up, and it has also widened.
| Quarter | Resales | Median psf | 25th percentile | 75th percentile |
|---|---|---|---|---|
| Q3 2024 | 14 | S$1,628 psf | S$1,567 psf | S$1,682 psf |
| Q4 2024 | 23 | S$1,609 psf | S$1,571 psf | S$1,635 psf |
| Q1 2025 | 13 | S$1,638 psf | S$1,593 psf | S$1,725 psf |
| Q2 2025 | 12 | S$1,660 psf | S$1,616 psf | S$1,680 psf |
| Q3 2025 | 12 | S$1,714 psf | S$1,648 psf | S$1,728 psf |
| Q4 2025 | 6 | S$1,673 psf | S$1,629 psf | S$1,701 psf |
| Q1 2026 | 11 | S$1,611 psf | S$1,592 psf | S$1,655 psf |
| Q2 2026 | 10 | S$1,656 psf | S$1,630 psf | S$1,725 psf |
The largest units in the window traded at the highest psf, not the smallest
The size table below runs against the usual pattern. The 90 to 119 sqm band has the highest median psf of the four, at S$1,784 psf. Its median price is S$1,737,500 on a median area of 980 sqft. The smallest band, under 50 sqm, came in at S$1,628 psf with a median price of S$800,000.
The busiest band was 70 to 89 sqm. It recorded 14 resales at a median of S$1,297,500, or S$1,619 psf on a median 786 sqft. That is the lowest median psf of the four bands. The 50 to 69 sqm band sits above it at S$1,703 psf, with 11 resales and a median price of S$1,100,000.
One caveat before you read too much into the top band. It has only 6 resales behind it. Floor level is not controlled for in this cut either. A band made up of higher-floor units will carry a higher psf for that reason alone.
| Size band | Resales | Median area | Median price | Median psf |
|---|---|---|---|---|
| under 50 sqm | 8 | 506 sqft | S$800,000 | S$1,628 psf |
| 50 to 69 sqm | 11 | 667 sqft | S$1,100,000 | S$1,703 psf |
| 70 to 89 sqm | 14 | 786 sqft | S$1,297,500 | S$1,619 psf |
| 90 to 119 sqm | 6 | 980 sqft | S$1,737,500 | S$1,784 psf |
Rental contracts snapped back to 50 in 2Q2026, and the psf median went with them
URA rental contracts at Parc Botannia show an uneven run. There were 59 contracts in 3Q2025, then 22 in 4Q2025, then 24 in 1Q2026. 2Q2026 brings it back to 50. The median psf a month follows a similar shape, from 5.3 down to 5.1 for two quarters, then up to 5.4.
The median monthly rent column moves differently. It reads S$3,250 in 4Q2025, the highest of the four quarters, in the quarter with the fewest contracts. In 2Q2026 the median rent is S$2,825 on far more contracts. The psf figure and the dollar figure can pull apart when the mix of unit sizes changes, and with 22 contracts the quarter is thin.
Set the latest rental median against the resale median and our engine measures a gross yield of about 3.8%. That is a measured figure from recorded contracts and caveats, not a valuation of any home.
| Quarter | Contracts | Median rent (S$ psf a month) | Median monthly rent |
|---|---|---|---|
| Q3 2025 | 59 | 5.3 | S$2,800 |
| Q4 2025 | 22 | 5.1 | S$3,250 |
| Q1 2026 | 24 | 5.1 | S$2,700 |
| Q2 2026 | 50 | 5.4 | S$2,825 |
Within 1 km, only High Park Residences is trading at a comparable psf
The nearby table covers the same four quarters, 3Q2025 to 2Q2026. High Park Residences is the closest condo at 140 m, and the busiest, with 61 resales at a median of S$1,652 psf. Rivertrees Residences, 813 m away, recorded 21 resales at S$1,622 psf. Below that, the gap opens up.
H2o Residences came in at S$1,505 psf on 14 resales. Riverbank @ Fernvale recorded 22 resales at S$1,480 psf. Lush Acres sits lowest at S$1,449 psf from 19 resales. All five are 99-year leasehold, like Parc Botannia itself.
The three landed rows are a different market and should be read separately. They are 999-year leasehold, and they carry 5, 3 and 2 transactions. The Jalan Tari Payong row reads S$2,309 psf on two sales. With counts that small, the medians say little about the wider street, and they are not comparable to condo psf.
| Project | Tenure | TOP | Distance | Resales | Median psf |
|---|---|---|---|---|---|
| High Park Residences | 99-year leasehold | — | 140 m | 61 | S$1,652 psf |
| Riverbank @ Fernvale | 99-year leasehold | — | 799 m | 22 | S$1,480 psf |
| Rivertrees Residences | 99-year leasehold | — | 813 m | 21 | S$1,622 psf |
| Lush Acres | 99-year leasehold | — | 603 m | 19 | S$1,449 psf |
| H2o Residences | 99-year leasehold | — | 846 m | 14 | S$1,505 psf |
| Landed, Jalan Tari Piring | 999-year leasehold | — | 442 m | 5 | S$1,837 psf |
| Landed, Lorong Tanggam | 999-year leasehold | — | 191 m | 3 | S$2,040 psf |
| Landed, Jalan Tari Payong | 999-year leasehold | — | 464 m | 2 | S$2,309 psf |
Every one of the five highest resales was a unit of roughly the same size
The top-price table clusters tightly. All five sales fall between 969 sqft and 1,023 sqft. The highest price in the window is S$1,750,000, and the same figure appears in two separate quarters. The first was a 980 sqft unit on the 11-15 storey range in 3Q2025, at S$1,787 psf. The second was a 980 sqft unit on the 16-20 range in 2Q2026, at the same psf.
Price and psf do not always rank the same way. The 1,023 sqft unit on the 21-25 storey range sold for S$1,720,000 in 1Q2026, which works out to S$1,682 psf. That is the lowest psf of the five, from the highest floor band in the list. Area is doing the work there.
4Q2025 contributes a S$1,745,000 sale at S$1,781 psf. So the project's ceiling has held across the window, even as the quarterly median moved up and down.
| Quarter | Storey range | Area | Price | Per sqft |
|---|---|---|---|---|
| Q3 2025 | 11-15 | 980 sqft | S$1,750,000 | S$1,787 psf |
| Q2 2026 | 16-20 | 980 sqft | S$1,750,000 | S$1,787 psf |
| Q4 2025 | 16-20 | 980 sqft | S$1,745,000 | S$1,781 psf |
| Q3 2025 | 16-20 | 969 sqft | S$1,730,000 | S$1,786 psf |
| Q1 2026 | 21-25 | 1,023 sqft | S$1,720,000 | S$1,682 psf |
Our own estimate was tested here, and it missed by 3.1% at the median
We hold our figures to the same standard as the transaction data. As of 4Q2025, we tested this site's estimate for Parc Botannia against 34 later sales at the project. The median error came in at 3.1%. Of those sales, 35% landed inside the stated range.
That second number is the one to sit with. It means most recorded sales fell outside the range we published for them. On a project where the quarterly median has swung between S$1,611 psf and S$1,714 psf, a tight range is hard to hold. Every estimate here is indicative, drawn from recorded transactions, and none of it is a formal valuation.
In pictures
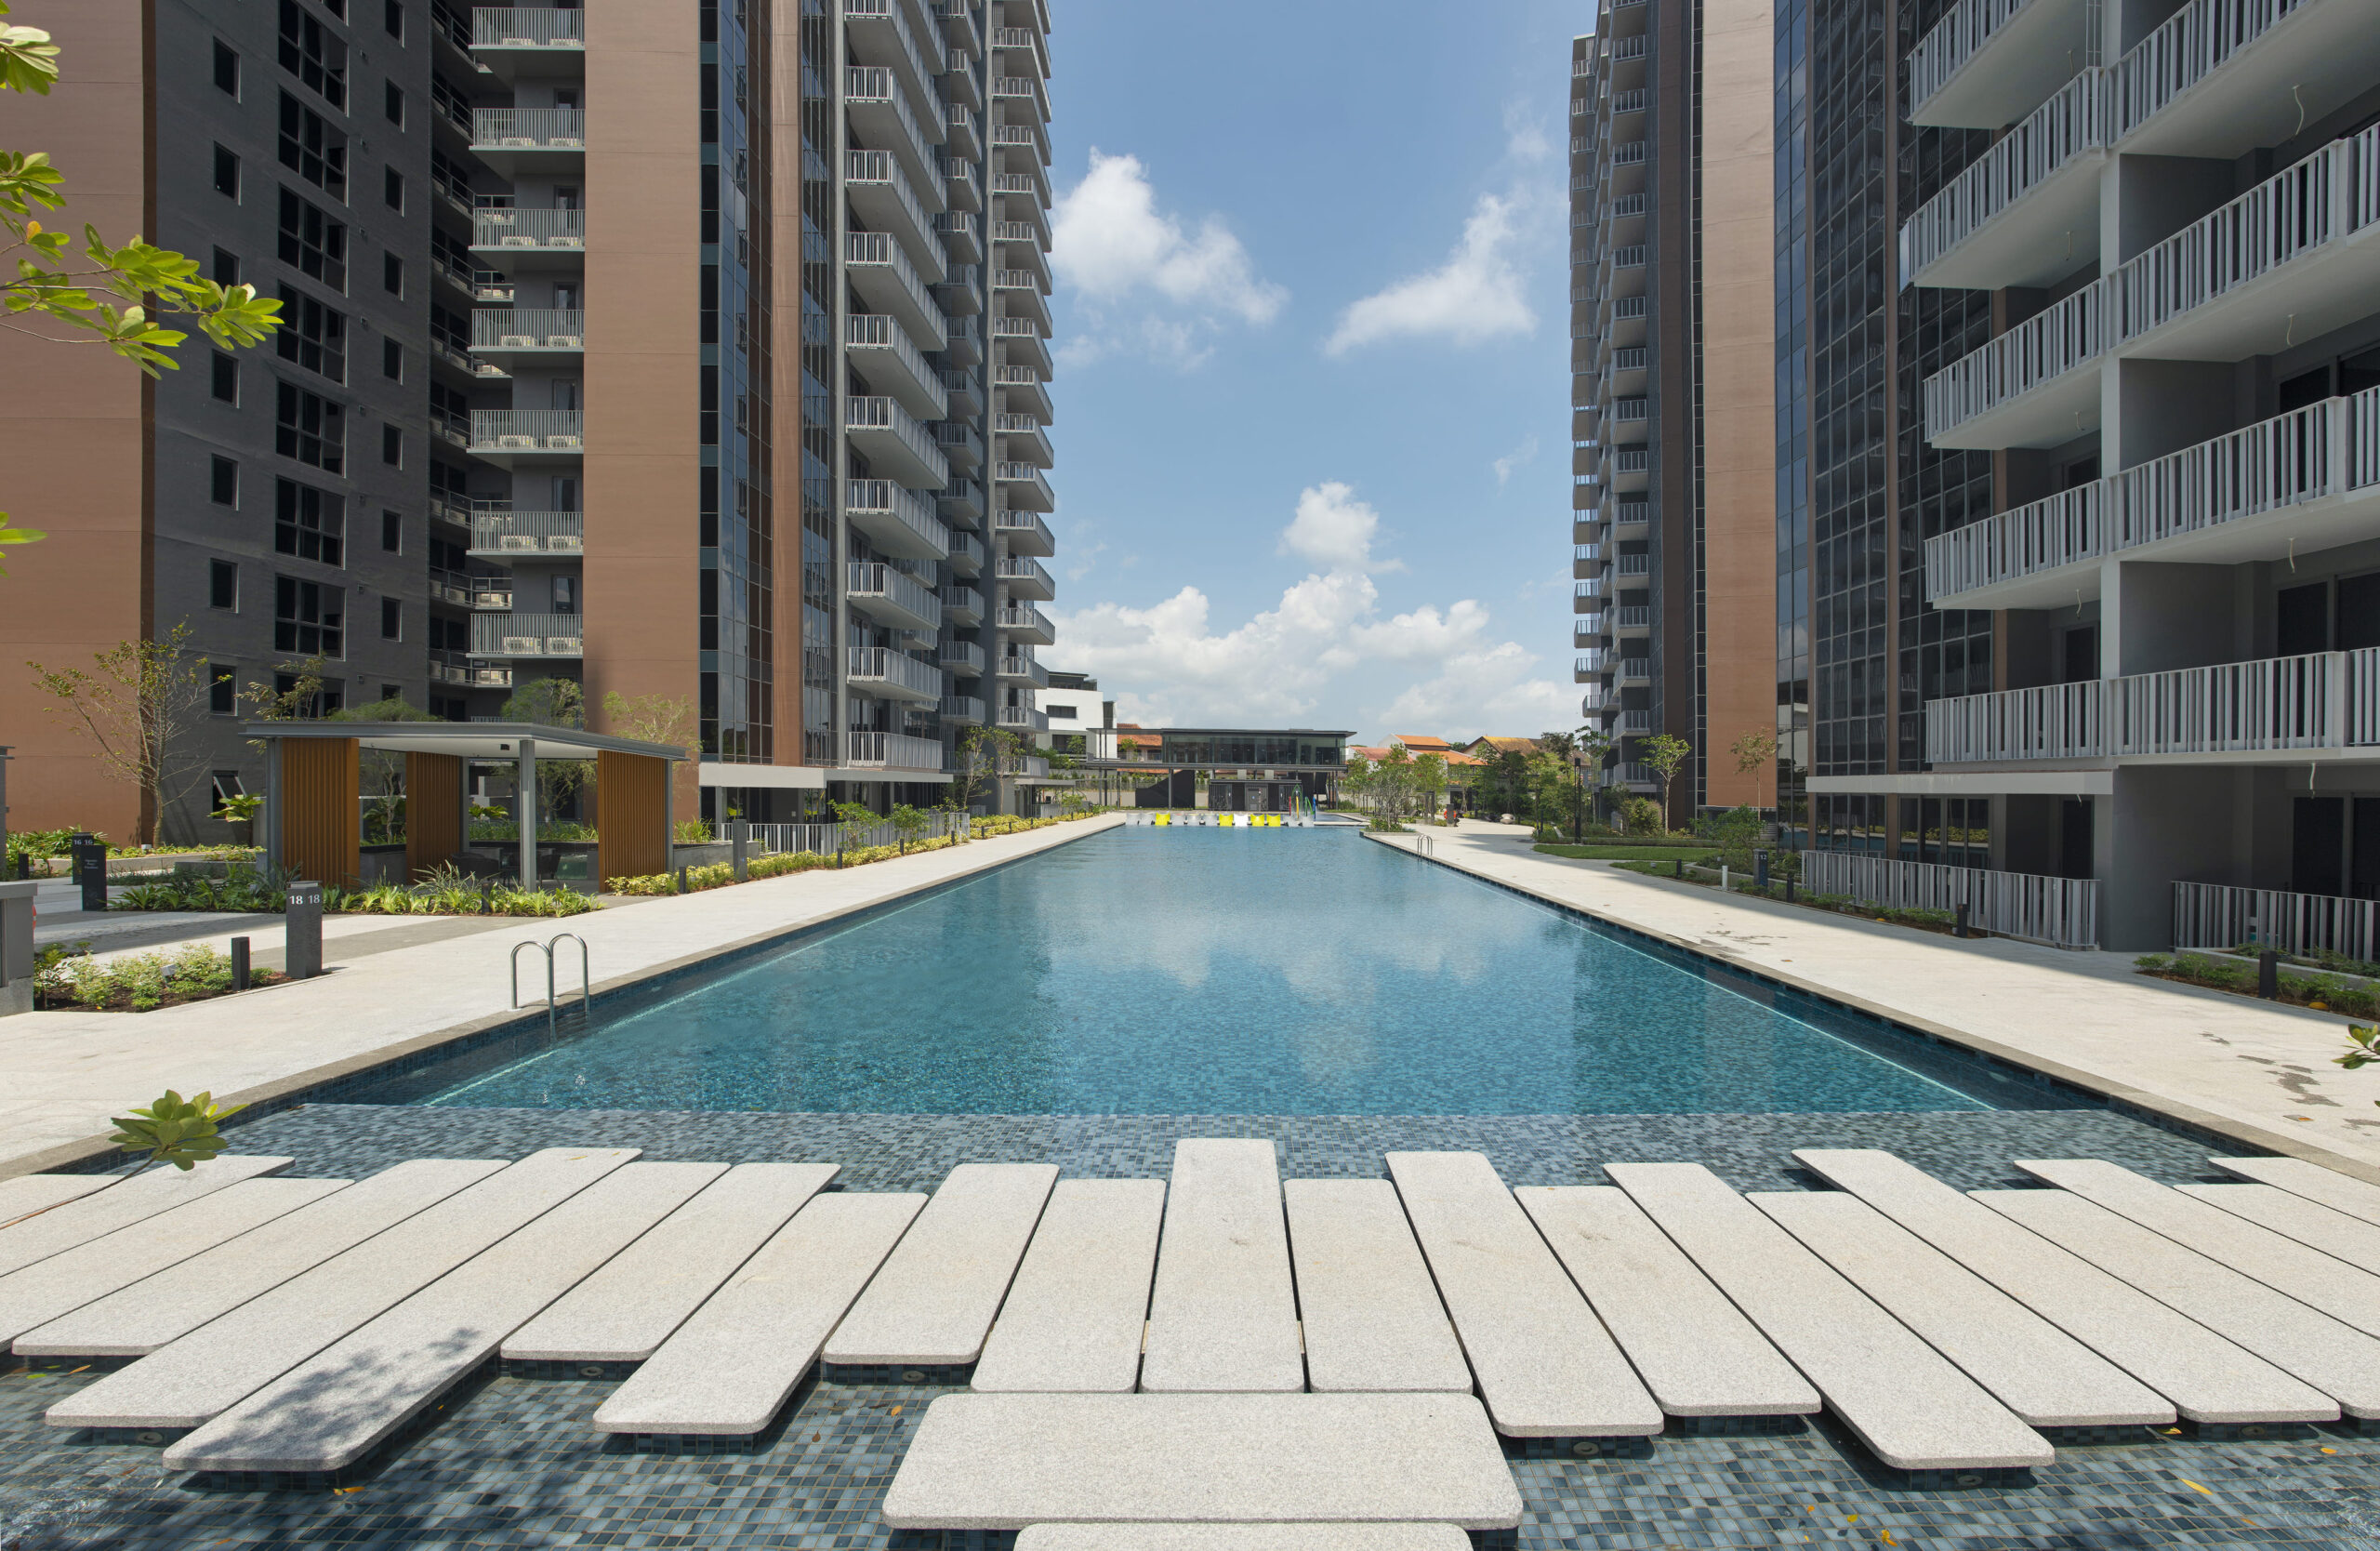
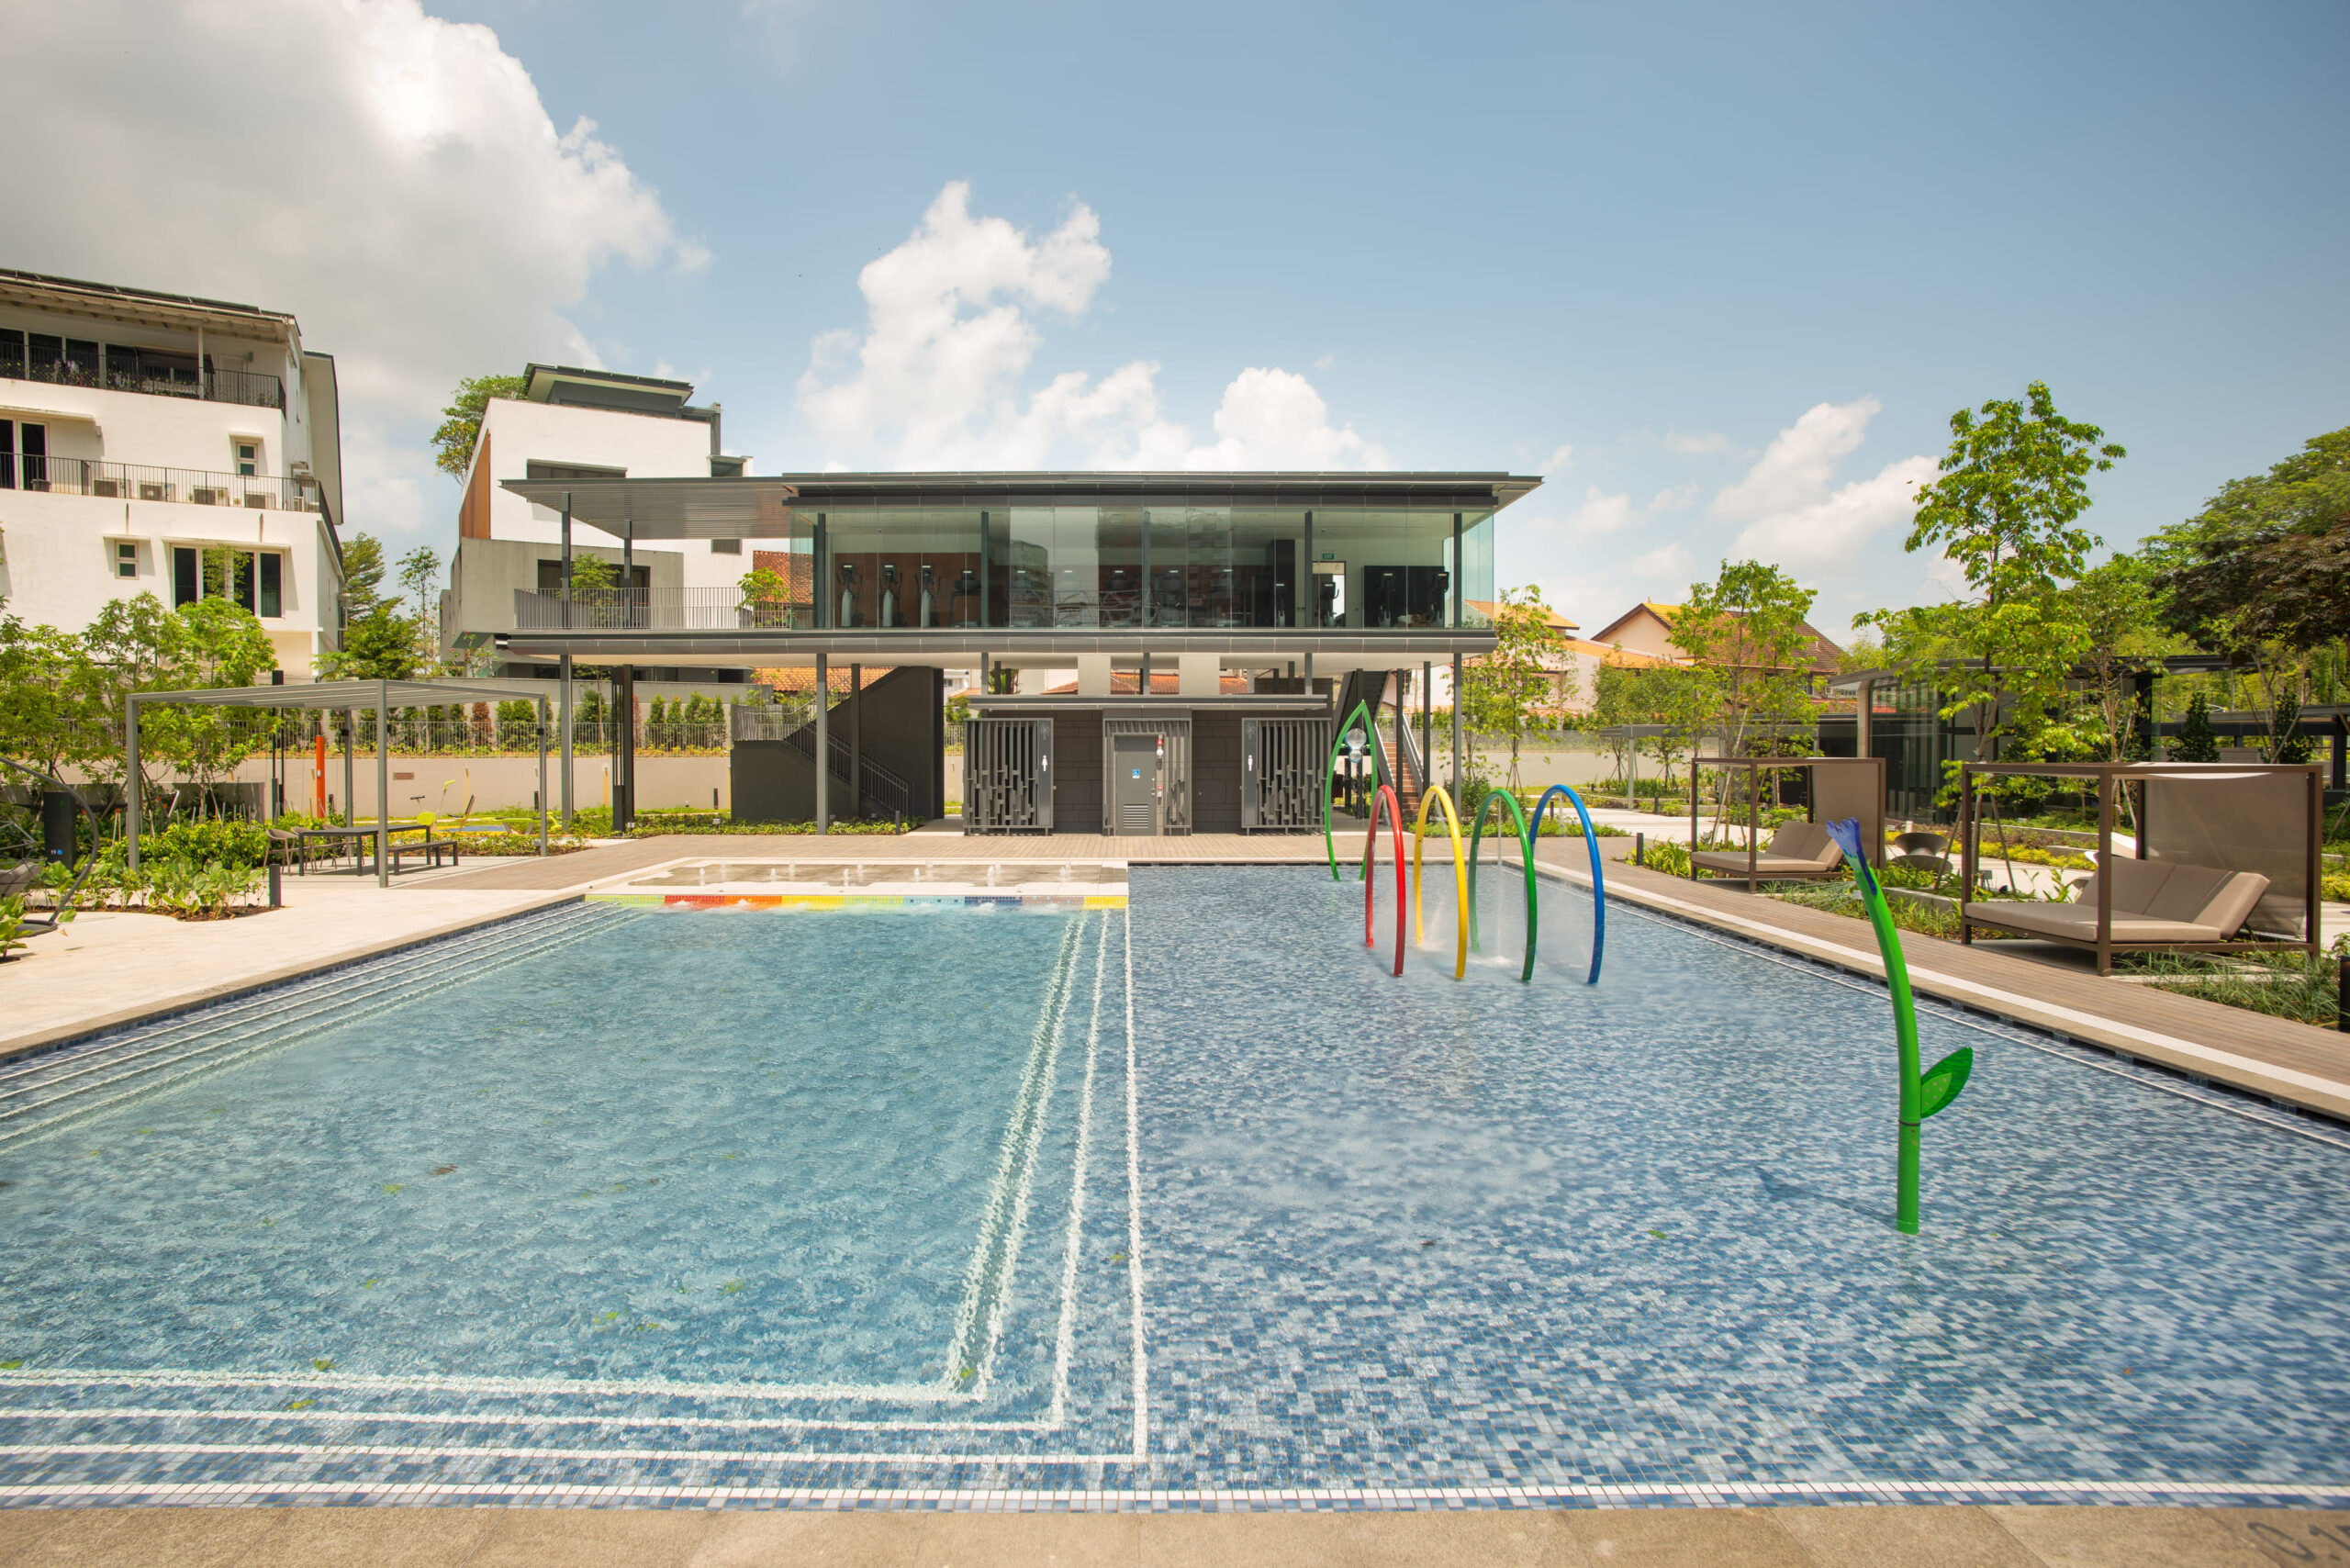
A few things the figures leave open. The 2Q2026 median is based on 10 sales. We cannot tell from this data whether the rise from 1Q2026 reflects pricing or mix. The same applies to the 90 to 119 sqm band and its 6 resales. The rental side has its own question. Contract counts moved from 59 to 22 to 24 to 50 across four quarters, and the psf median and the dollar median did not move together. Next quarter's caveats and rental approvals will show whether the contract count holds near 50, and whether the larger units keep clearing near the project's ceiling.
Read on its own, the +1.7% headline makes Parc Botannia look static. The tables underneath say otherwise. One median, one quarter, one project rarely settles anything by itself. What it is worth is the context it sits in: the district median, the five leasehold neighbours within 1 km, and eight quarters of counts that are often smaller than they look.
Method: URA resale caveats at the project (developer sales and sub-sales excluded) by the quarter of the sale month. Size bands by caveated floor area. Rents are URA rental contracts at the project, and the gross yield is the mean of the quarterly median rents per square foot, annualised, over the four-quarter resale median per square foot, before any cost. Lease left is the tenure less the years since the lease started, as recorded. The estimate accuracy is this site's backtest: the engine run as of the quarter named, compared with the sales since. Private figures are from URA Data Service caveats, HDB figures from data.gov.sg resale records, both loaded weekly by this site's ingest. Medians are of the non-excluded transactions in the period named. Sales flagged by the hygiene rules (related-party transfers, bulk deals, outliers) are left out. Every figure is indicative and drawn from recorded transactions, not a formal valuation.