Lentor Gardens Residences: 205 Units Sold At A Median Of S$2,367 psf (September 2026)
Published 22 Oct 2026 · Lentor Gardens Residences
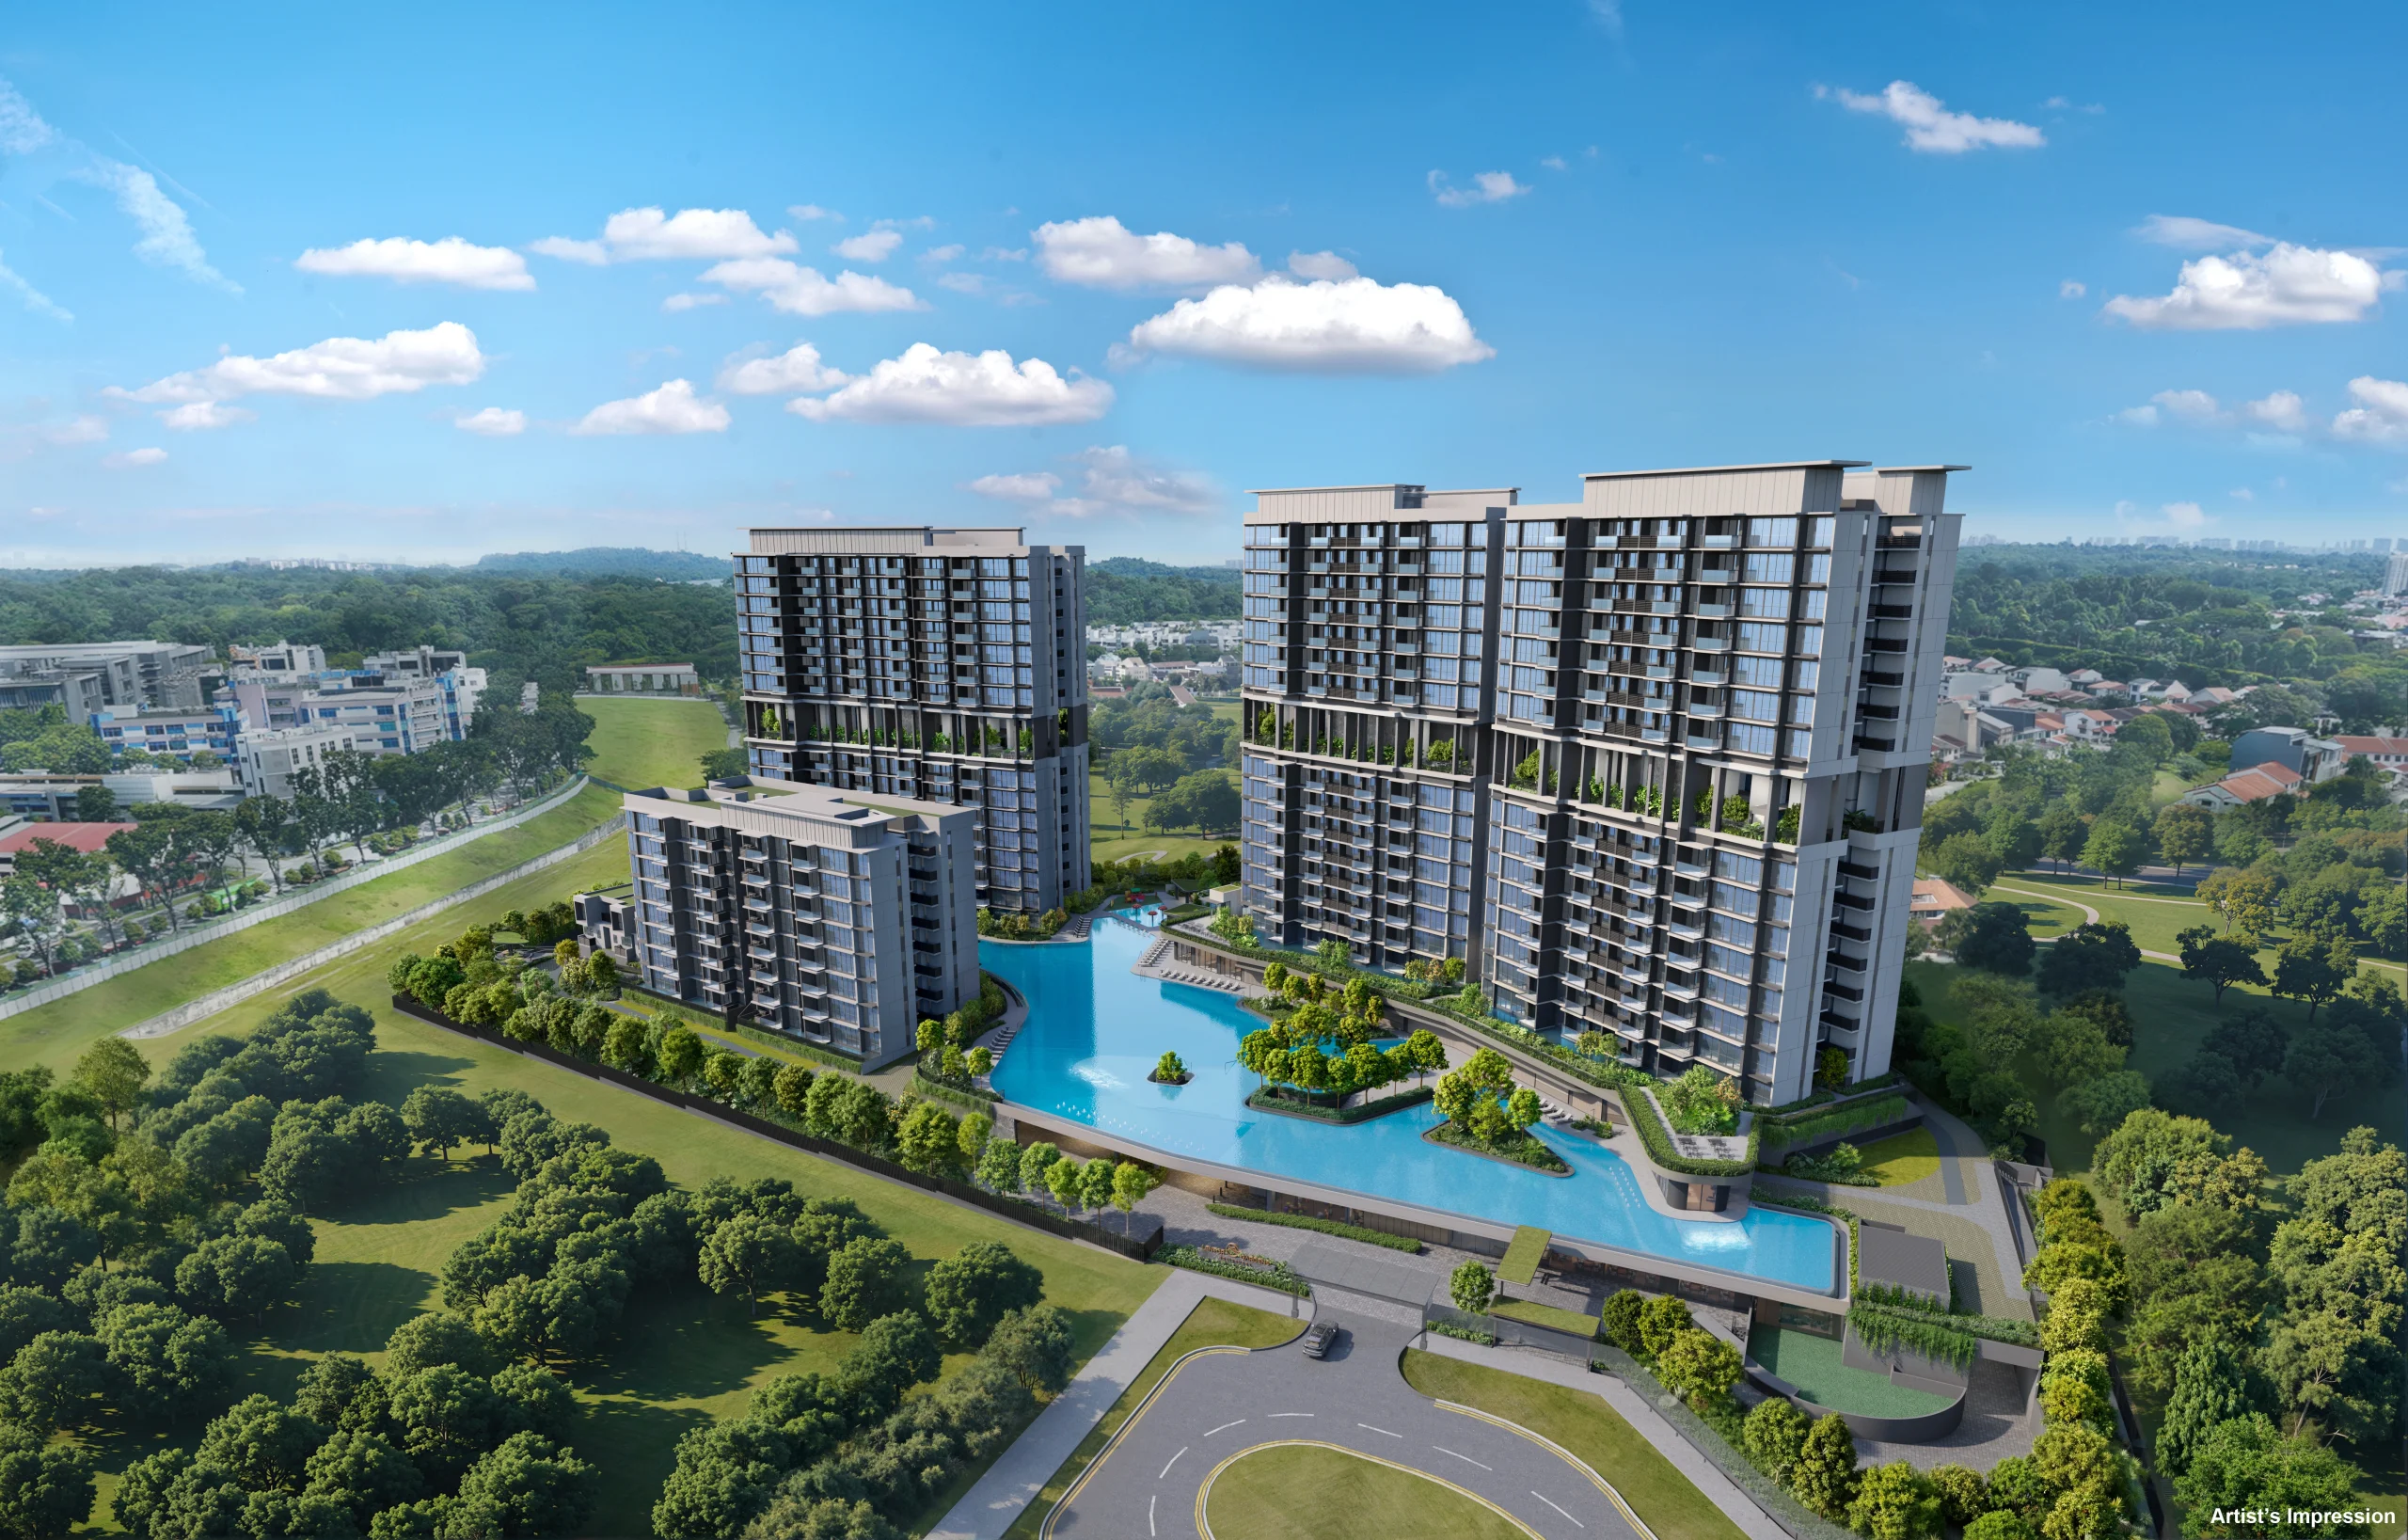
If you are watching the Lentor area, a new launch gives you a fresh set of price points to read. Caveats from a launch tell you what buyers paid, by month and by unit size.
In this article, we look at developer sales at Lentor Gardens Residences month by month, the split by unit size, resale prices within 1 km, and how the project compares with other District 26 launches.
The project has recorded 205 developer sales since July 2026 at an overall median of S$2,367 psf, based on caveat data from the URA Data Service. That is 41.1% of its 499 units.
How Many Units Sold Each Month?
Lentor Gardens Residences started selling in July 2026. All 205 caveats fall within the three months to September 2026.
The table and chart below show the monthly count and the running total.
The busiest month was July 2026 with 174 caveats. August 2026 added 14 and September 2026 added 17. The median psf moved from S$2,367 psf in the first month to S$2,384 psf in September 2026, a change of +0.7%. Note that the later months rest on small counts, so the medians there cover far fewer deals.
| Month | Caveats | Cumulative | Median psf |
|---|---|---|---|
| July 2026 | 174 | 174 | S$2,367 psf |
| August 2026 | 14 | 188 | S$2,372 psf |
| September 2026 | 17 | 205 | S$2,384 psf |
Which Unit Sizes Sold Most?
Caveats also record the floor area, so the sales can be grouped into size bands. The table below sets out the four bands.
The 90 to 119 sqm band was the most sold, with 91 caveats at a median price of S$2,415,300 and a median of S$2,337 psf. The 50 to 69 sqm band followed with 74 caveats, at a median of S$1,647,900 and S$2,395 psf.
Note that the largest band, 120 sqm and above, has only 11 caveats, at a median of S$3,242,700 and S$2,410 psf. The psf figures across the bands sit within a narrow range, while the total prices differ widely with size.
| Size band | Caveats | Median area | Median price | Median psf |
|---|---|---|---|---|
| 50 to 69 sqm | 74 | 689 sqft | S$1,647,900 | S$2,395 psf |
| 70 to 89 sqm | 29 | 936 sqft | S$2,144,600 | S$2,360 psf |
| 90 to 119 sqm | 91 | 1,012 sqft | S$2,415,300 | S$2,337 psf |
| 120 sqm and above | 11 | 1,345 sqft | S$3,242,700 | S$2,410 psf |
How Does It Compare With Resales Nearby?
Within 1,000 m of the project, 330 resales across 28 completed projects were recorded over the 24 months to September 2026. The median for those resales was S$1,796 psf, and the launch median is +31.8% against that.
The table below lists the nearest projects by resale count.
The Panorama recorded the most resales at 67, with a median of S$2,041 psf. Sembawang Hills Estate followed with 58 resales at S$2,121 psf. The range is wide: Far Horizon Gardens sat at S$1,121 psf and Seasons Park at S$1,321 psf. These are completed projects of differing age and tenure, so the gap reflects a mix of stock rather than like-for-like units.
| Project | Tenure | TOP | Distance | Resales | Median psf |
|---|---|---|---|---|---|
| The Panorama | 99-year leasehold | — | 808 m | 67 | S$2,041 psf |
| Sembawang Hills Estate | freehold | — | 860 m | 58 | S$2,121 psf |
| Castle Green | 99-year leasehold | — | 901 m | 33 | S$1,339 psf |
| Meadows @ Peirce | freehold | — | 642 m | 28 | S$1,702 psf |
| The Calrose | freehold | — | 376 m | 20 | S$1,996 psf |
| Seasons Park | 99-year leasehold | — | 744 m | 20 | S$1,321 psf |
| Thomson Hills Estate | freehold | — | 804 m | 17 | S$1,815 psf |
| Far Horizon Gardens | 99-year leasehold | — | 687 m | 14 | S$1,121 psf |
Other Launches In District 26
Several other District 26 projects also recorded developer sales over the 12 months to September 2026. The table below shows them.
Springleaf Residence sold the most with 43 caveats at a median of S$2,228 psf. Lentoria recorded 22 caveats at S$2,397 psf, and Hillock Green 11 at S$2,113 psf. Lentor Mansion, Lentor Central Residences and Mandai Garden recorded two caveats or fewer each, so their medians rest on very few deals.
| Project | Tenure | Expected TOP | Caveats | Median psf |
|---|---|---|---|---|
| Springleaf Residence | 99-year leasehold | — | 43 | S$2,228 psf |
| Lentoria | 99-year leasehold | 2,027 | 22 | S$2,397 psf |
| Hillock Green | 99-year leasehold | 2,026 | 11 | S$2,113 psf |
| Lentor Mansion | 99-year leasehold | 2,027 | 2 | S$2,160 psf |
| Lentor Central Residences | 99-year leasehold | 2,027 | 1 | S$1,914 psf |
| Mandai Garden | 999-year leasehold | — | 1 | S$2,600 psf |
Key Takeaways
Lentor Gardens Residences has recorded 205 developer sales since July 2026, or 41.1% of its 499 units, at an overall median of S$2,367 psf. July 2026 carried most of that volume with 174 caveats. The 90 to 119 sqm band was the most sold, at 91 caveats and a median price of S$2,415,300.
These figures are indicative and drawn from recorded transactions, not a valuation of any home. Caveats show what was paid, not the floor, stack or finish behind each price, and medians over small monthly counts can move on mix alone.
In pictures
Method: URA caveats for developer sales ('new sale') at the project, dated to the month. Size bands by the caveated floor area. The nearby comparison is resale caveats in completed projects within one kilometre over 24 months, unadjusted for size, age or floor. Units sold is the caveat count, which lags option exercises by weeks. Private figures are from URA Data Service caveats, HDB figures from data.gov.sg resale records, both loaded weekly by this site's ingest. Medians are of the non-excluded transactions in the period named. Sales flagged by the hygiene rules (related-party transfers, bulk deals, outliers) are left out. Every figure is indicative and drawn from recorded transactions, not a formal valuation.