Grand Dunman By The Numbers, September 2026: 703 Units Sold At A Median Of S$2,517 psf
Published 22 Oct 2026 · Grand Dunman
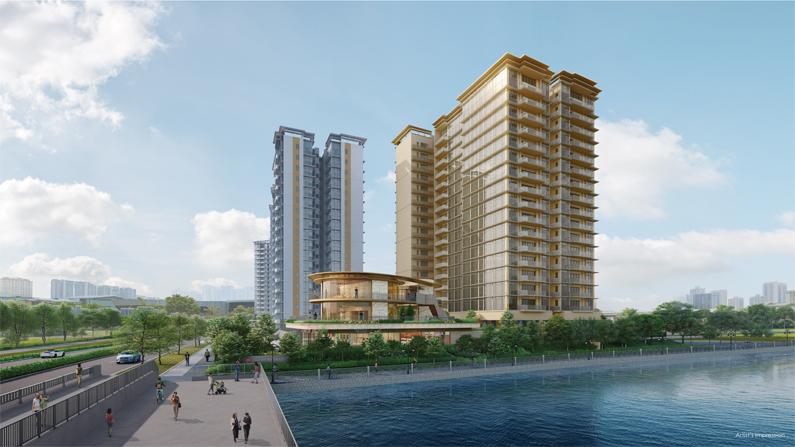
Grand Dunman has been selling for 39 months. If you are watching District 15, the month-by-month record shows how a large launch moves after its opening weekend.
In this article, we look at Grand Dunman's developer sales by month and by unit size. We also compare them with nearby resales and with other District 15 launches.
The project has recorded 703 developer sales since July 2023, at an overall median of S$2,517 psf. That is 69.7% of its 1,008 units. The figures come from URA Data Service caveats, which are recorded transactions rather than valuations.
The developer is SingHaiyi Group, according to the developer's website.
How Many Units Have Sold Each Month?
Grand Dunman is a 99-year leasehold project in District 15. The table and chart below set out caveats by month, the running total, and the median psf in each month.
The busiest month was July 2023, with 349 caveats. Sales have been thinner since. The three months to September 2026 brought 22 caveats in total, including two in September 2026 itself.
Note that the median psf has stayed in a narrow range. It was S$2,502 psf in the first month and S$2,447 psf in September 2026, a move of -2.2%. Monthly medians in single-digit months rest on very few caveats.
| Month | Caveats | Cumulative | Median psf |
|---|---|---|---|
| July 2023 | 349 | 349 | S$2,502 psf |
| August 2023 | 25 | 374 | S$2,562 psf |
| September 2023 | 14 | 388 | S$2,552 psf |
| October 2023 | 13 | 401 | S$2,422 psf |
| November 2023 | 14 | 415 | S$2,541 psf |
| December 2023 | 6 | 421 | S$2,524 psf |
| January 2024 | 4 | 425 | S$2,533 psf |
| February 2024 | 10 | 435 | S$2,531 psf |
| March 2024 | 23 | 458 | S$2,455 psf |
| April 2024 | 6 | 464 | S$2,549 psf |
| May 2024 | 7 | 471 | S$2,552 psf |
| June 2024 | 3 | 474 | S$2,560 psf |
| July 2024 | 22 | 496 | S$2,550 psf |
| August 2024 | 1 | 497 | S$2,720 psf |
| September 2024 | 4 | 501 | S$2,511 psf |
| October 2024 | 6 | 507 | S$2,599 psf |
| November 2024 | 17 | 524 | S$2,594 psf |
| December 2024 | 7 | 531 | S$2,546 psf |
| January 2025 | 4 | 535 | S$2,590 psf |
| February 2025 | 5 | 540 | S$2,553 psf |
| March 2025 | 5 | 545 | S$2,566 psf |
| April 2025 | 12 | 557 | S$2,620 psf |
| May 2025 | 12 | 569 | S$2,616 psf |
| June 2025 | 12 | 581 | S$2,549 psf |
| July 2025 | 26 | 607 | S$2,454 psf |
| August 2025 | 19 | 626 | S$2,558 psf |
| September 2025 | 14 | 640 | S$2,514 psf |
| October 2025 | 5 | 645 | S$2,487 psf |
| November 2025 | 3 | 648 | S$2,556 psf |
| December 2025 | 2 | 650 | S$2,432 psf |
| January 2026 | 13 | 663 | S$2,506 psf |
| February 2026 | 1 | 664 | S$2,514 psf |
| March 2026 | 9 | 673 | S$2,517 psf |
| April 2026 | 2 | 675 | S$2,429 psf |
| May 2026 | 3 | 678 | S$2,425 psf |
| June 2026 | 3 | 681 | S$2,576 psf |
| July 2026 | 13 | 694 | S$2,515 psf |
| August 2026 | 7 | 701 | S$2,525 psf |
| September 2026 | 2 | 703 | S$2,447 psf |
Which Unit Sizes Sold Most?
Caveats split into five size bands. The table below gives the count, median area, median price and median psf for each.
The 70 to 89 sqm band was the largest, with 200 caveats. Its median area was 797 sqft and its median price S$2,118,852, or S$2,498 psf.
The 120 sqm and above band follows with 198 caveats, at a median price of S$3,743,500. Smaller units carry the higher psf. Under 50 sqm sits at S$2,609 psf, against S$2,490 psf for the largest band.
| Size band | Caveats | Median area | Median price | Median psf |
|---|---|---|---|---|
| under 50 sqm | 46 | 452 sqft | S$1,179,500 | S$2,609 psf |
| 50 to 69 sqm | 136 | 667 sqft | S$1,620,500 | S$2,558 psf |
| 70 to 89 sqm | 200 | 797 sqft | S$2,118,853 | S$2,498 psf |
| 90 to 119 sqm | 123 | 1,119 sqft | S$2,738,000 | S$2,519 psf |
| 120 sqm and above | 198 | 1,475 sqft | S$3,743,500 | S$2,490 psf |
How Do Nearby Resales Compare?
Within 1,000 m of Grand Dunman, 707 resales were recorded across 165 completed projects in the 24 months to September 2026. The median was S$1,910 psf. The launch median runs 31.8% above that.
The table below shows the busiest of those nearby projects by resale count.
Park Place Residences At Plq led on volume, with 45 resales at a median of S$2,285 psf. The Esta recorded the highest median among them, at S$2,428 psf. Dunman View, the closest at 175 m, had 13 resales at S$1,590 psf. Tenure and age differ across these projects, so the gaps are not like-for-like.
| Project | Tenure | TOP | Distance | Resales | Median psf |
|---|---|---|---|---|---|
| Park Place Residences At Plq | 99-year leasehold | — | 846 m | 45 | S$2,285 psf |
| The Shore Residences | 103-year leasehold | — | 992 m | 34 | S$2,129 psf |
| One Amber | freehold | — | 930 m | 33 | S$2,296 psf |
| Waterbank At Dakota | 99-year leasehold | — | 792 m | 31 | S$2,119 psf |
| The Esta | freehold | — | 934 m | 29 | S$2,428 psf |
| Haig Court | freehold | — | 436 m | 18 | S$2,099 psf |
| The Waterina | freehold | — | 662 m | 16 | S$1,990 psf |
| Dunman View | 99-year leasehold | — | 175 m | 13 | S$1,590 psf |
What Did Other District 15 Launches Do?
Grand Dunman is not the only project selling in the district. The table below covers developer sales at other District 15 launches over the 12 months to September 2026.
The Continuum sold the most, with 180 caveats at a median of S$2,795 psf. Arina East Residences follows with 67 caveats at S$2,821 psf.
Note that the highest medians sit with the smallest counts. Meyer Blue recorded 20 caveats at S$3,170 psf, and Amber House 28 caveats at S$3,104 psf. All but Tembusu Grand on this list are freehold.
| Project | Tenure | Expected TOP | Caveats | Median psf |
|---|---|---|---|---|
| The Continuum | freehold | — | 180 | S$2,795 psf |
| Arina East Residences | freehold | — | 67 | S$2,821 psf |
| Amber House | freehold | — | 28 | S$3,104 psf |
| Meyer Blue | freehold | 2,028 | 20 | S$3,170 psf |
| Verdé Joo Chiat | freehold | — | 18 | S$2,440 psf |
| Ardor Residence | freehold | — | 12 | S$2,558 psf |
| Claydence | freehold | — | 8 | S$2,526 psf |
| Tembusu Grand | 99-year leasehold | — | 7 | S$2,704 psf |
Key Takeaways
Grand Dunman has sold 703 of 1,008 units since July 2023, or 69.7%, at an overall median of S$2,517 psf. July 2023 alone accounted for 349 caveats. The median psf has shifted -2.2% from the first month to September 2026. The most sold band was 70 to 89 sqm, with 200 caveats at a median of S$2,118,852.
These are medians of recorded caveats, not valuations of any home. They tell you what was lodged and at what price. They cannot tell you which stacks, floors or facings are left, and months with one or two caveats say little on their own.
Method: URA caveats for developer sales ('new sale') at the project, dated to the month. Size bands by the caveated floor area. The nearby comparison is resale caveats in completed projects within one kilometre over 24 months, unadjusted for size, age or floor. Units sold is the caveat count, which lags option exercises by weeks. Private figures are from URA Data Service caveats, HDB figures from data.gov.sg resale records, both loaded weekly by this site's ingest. Medians are of the non-excluded transactions in the period named. Sales flagged by the hygiene rules (related-party transfers, bulk deals, outliers) are left out. Every figure is indicative and drawn from recorded transactions, not a formal valuation. Facilities, layouts and photographs, where shown, are as supplied by the developer or seen on our own visit, and are not engine data.