The Tre Ver By The Numbers: 60 Resales At A Median Of S$2,011 psf (Q3 2025 To Q2 2026)
Published 3 Oct 2026 · The Tre Ver
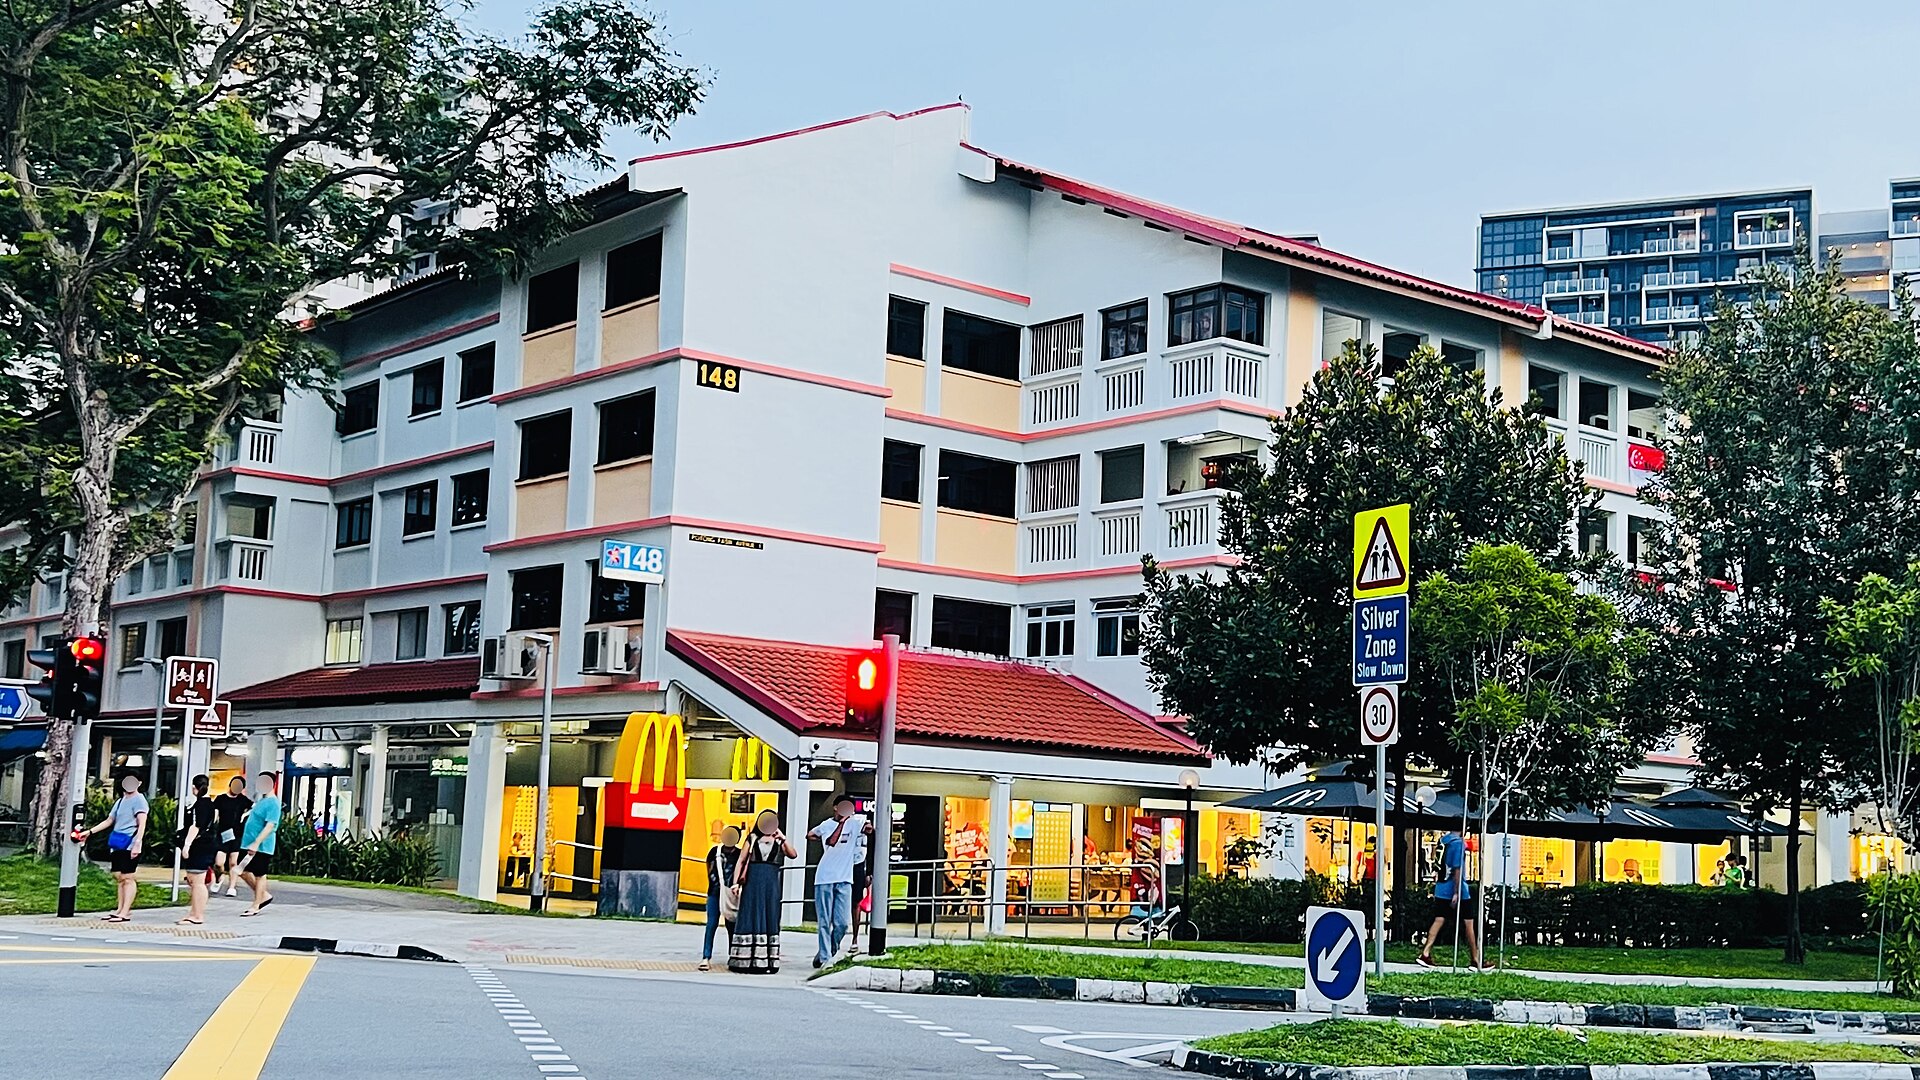
If you own, rent or are tracking a unit at The Tre Ver, the transaction record is the clearest view you have. Caveats show what buyers actually paid, quarter by quarter.
In this article, we look at eight quarters of resales at the project. We also cover prices by unit size, rental contracts and gross yield. The nearby projects and our own estimate accuracy are covered too.
The Tre Ver is a 99-year leasehold condo in District 13, with 91 years of lease left. It recorded 60 resales over Q3 2025 to Q2 2026 at a median of S$2,011 psf, based on URA Data Service caveats.
How Have Resale Prices Moved By Quarter?
The quarterly median gives the simplest read on the project. Counts matter here, because some quarters are thin.
The table and chart below show both figures together.
Across the eight quarters shown, the median moved +0.7%. It started at S$1,991 psf in Q3 2024 from 16 sales. It ended at S$2,005 psf in Q2 2026 from 12 sales. Note that Q1 2026 had only 4 resales, so that quarter's S$2,031 psf rests on a very small count. The highest quarterly median in the window was S$2,038 psf in Q4 2025.
| Quarter | Resales | Median psf | 25th percentile | 75th percentile |
|---|---|---|---|---|
| Q3 2024 | 16 | S$1,991 psf | S$1,964 psf | S$2,007 psf |
| Q4 2024 | 12 | S$1,972 psf | S$1,893 psf | S$2,005 psf |
| Q1 2025 | 13 | S$2,001 psf | S$1,898 psf | S$2,056 psf |
| Q2 2025 | 15 | S$1,993 psf | S$1,904 psf | S$2,079 psf |
| Q3 2025 | 26 | S$1,999 psf | S$1,958 psf | S$2,059 psf |
| Q4 2025 | 18 | S$2,038 psf | S$1,961 psf | S$2,054 psf |
| Q1 2026 | 4 | S$2,031 psf | S$2,001 psf | S$2,068 psf |
| Q2 2026 | 12 | S$2,005 psf | S$1,958 psf | S$2,035 psf |
What Did Each Unit Size Fetch?
Resale prices at the project vary a fair bit by size band. The table below splits the 60 resales over Q3 2025 to Q2 2026.
Units of 50 to 69 sqm were the most traded. There were 34 resales at a median of S$1,426,500, or S$2,030 psf. The 90 to 119 sqm band had 11 resales at a median of S$2,290,000. That band also had the highest median psf, at S$2,077 psf.
The smallest band sat lowest on both measures. Eight resales under 50 sqm had a median price of S$920,500 and a median of S$1,839 psf.
| Size band | Resales | Median area | Median price | Median psf |
|---|---|---|---|---|
| under 50 sqm | 8 | 501 sqft | S$920,500 | S$1,839 psf |
| 50 to 69 sqm | 34 | 700 sqft | S$1,426,500 | S$2,030 psf |
| 70 to 89 sqm | 7 | 753 sqft | S$1,500,000 | S$1,991 psf |
| 90 to 119 sqm | 11 | 1,098 sqft | S$2,290,000 | S$2,077 psf |
Rents And Gross Yield At The Tre Ver
Rental approvals are logged separately from sales. The table below shows four quarters of contracts at the project.
Q2 2026 brought 25 contracts. The median was S$6.67 psf a month, and the median monthly rent was S$3,500. Against the resale median, that works out to a gross yield of about 3.7%, measured by this site's engine.
Contract counts fell across the window. There were 59 contracts in Q3 2025, then 30, then 34, then 25 in Q2 2026. The median psf a month rose over the same four quarters.
| Quarter | Contracts | Median rent (S$ psf a month) | Median monthly rent |
|---|---|---|---|
| Q3 2025 | 59 | 5.8 | S$3,800 |
| Q4 2025 | 30 | 6.0 | S$3,675 |
| Q1 2026 | 34 | 6.2 | S$3,800 |
| Q2 2026 | 25 | 6.7 | S$3,500 |
How Does It Compare With Nearby Projects?
District 13 recorded 407 resales over the same four quarters, at a median of S$1,996 psf. The Tre Ver sits +0.7% against that district median.
The table below lists resales within 1 km of the project.
Park Colonial, 545 m away, had the most resales at 44, with a median of S$2,302 psf. The Poiz Residences logged 36 resales at S$2,081 psf. At the other end, The Acacias recorded 6 resales at S$1,554 psf. Note that the smaller counts here cover only a handful of units each.
| Project | Tenure | TOP | Distance | Resales | Median psf |
|---|---|---|---|---|---|
| Park Colonial | 99-year leasehold | — | 545 m | 44 | S$2,302 psf |
| The Poiz Residences | 99-year leasehold | — | 571 m | 36 | S$2,081 psf |
| Nin Residence | 99-year leasehold | — | 621 m | 14 | S$1,750 psf |
| The Venue Residences | 99-year leasehold | — | 976 m | 13 | S$1,951 psf |
| 8@Woodleigh | 99-year leasehold | — | 458 m | 12 | S$1,904 psf |
| Sant Ritz | 99-year leasehold | — | 860 m | 8 | S$1,842 psf |
| Riviera 38 | 999-year leasehold | — | 957 m | 6 | S$1,583 psf |
| The Acacias | freehold | — | 935 m | 6 | S$1,554 psf |
The Top Resale Prices In The Window
The largest units set the top of the range. The table below lists the five highest resale prices recorded.
The highest was S$2,350,000 in Q4 2025, for a 1,109 sqft unit on the 16-20 storey range. That worked out to S$2,120 psf. A 1,098 sqft unit in the same quarter also sold for S$2,350,000, at S$2,140 psf.
On a psf basis, the highest in the table was S$2,180 psf. That was a 1,055 sqft unit on the 06-10 storey range in Q3 2025.
| Quarter | Storey range | Area | Price | Per sqft |
|---|---|---|---|---|
| Q4 2025 | 16-20 | 1,109 sqft | S$2,350,000 | S$2,120 psf |
| Q4 2025 | 16-20 | 1,098 sqft | S$2,350,000 | S$2,140 psf |
| Q3 2025 | 11-15 | 1,098 sqft | S$2,300,000 | S$2,095 psf |
| Q3 2025 | 06-10 | 1,055 sqft | S$2,300,000 | S$2,180 psf |
| Q3 2025 | 11-15 | 1,109 sqft | S$2,290,000 | S$2,066 psf |
How Accurate Is Our Estimate Here?
We test our estimate against sales recorded after it was made. For The Tre Ver, the test used 42 later sales as of Q4 2025.
The median error was 1.9%. Of those sales, 36% landed inside the stated range. These figures describe how the model has tracked recorded transactions at this project. They are not a valuation of any home.
Summary
The Tre Ver recorded 60 resales over Q3 2025 to Q2 2026 at a median of S$2,011 psf. The quarterly median moved +0.7% across eight quarters, from S$1,991 psf in Q3 2024 to S$2,005 psf in Q2 2026. The 50 to 69 sqm band was the busiest, with 34 resales at a median of S$1,426,500. Rents in Q2 2026 came from 25 contracts, at a median of S$3,500 a month.
These figures are indicative and drawn from recorded transactions. They come from URA Data Service caveats and rental contracts, with yields measured by this site's engine. They show what was transacted and when. They cannot tell you what any single unit at the project is worth, and quarters with few sales can shift the median.
Method: URA resale caveats at the project (developer sales and sub-sales excluded) by the quarter of the sale month. Size bands by caveated floor area. Rents are URA rental contracts at the project, and the gross yield is the mean of the quarterly median rents per square foot, annualised, over the four-quarter resale median per square foot, before any cost. Lease left is the tenure less the years since the lease started, as recorded. The estimate accuracy is this site's backtest: the engine run as of the quarter named, compared with the sales since. Private figures are from URA Data Service caveats, HDB figures from data.gov.sg resale records, both loaded weekly by this site's ingest. Medians are of the non-excluded transactions in the period named. Sales flagged by the hygiene rules (related-party transfers, bulk deals, outliers) are left out. Every figure is indicative and drawn from recorded transactions, not a formal valuation.