The Topiary By The Numbers: 45 Resales At A Median Of S$1,537 psf (Q3 2025 To Q2 2026)
Published 10 Oct 2026 · The Topiary
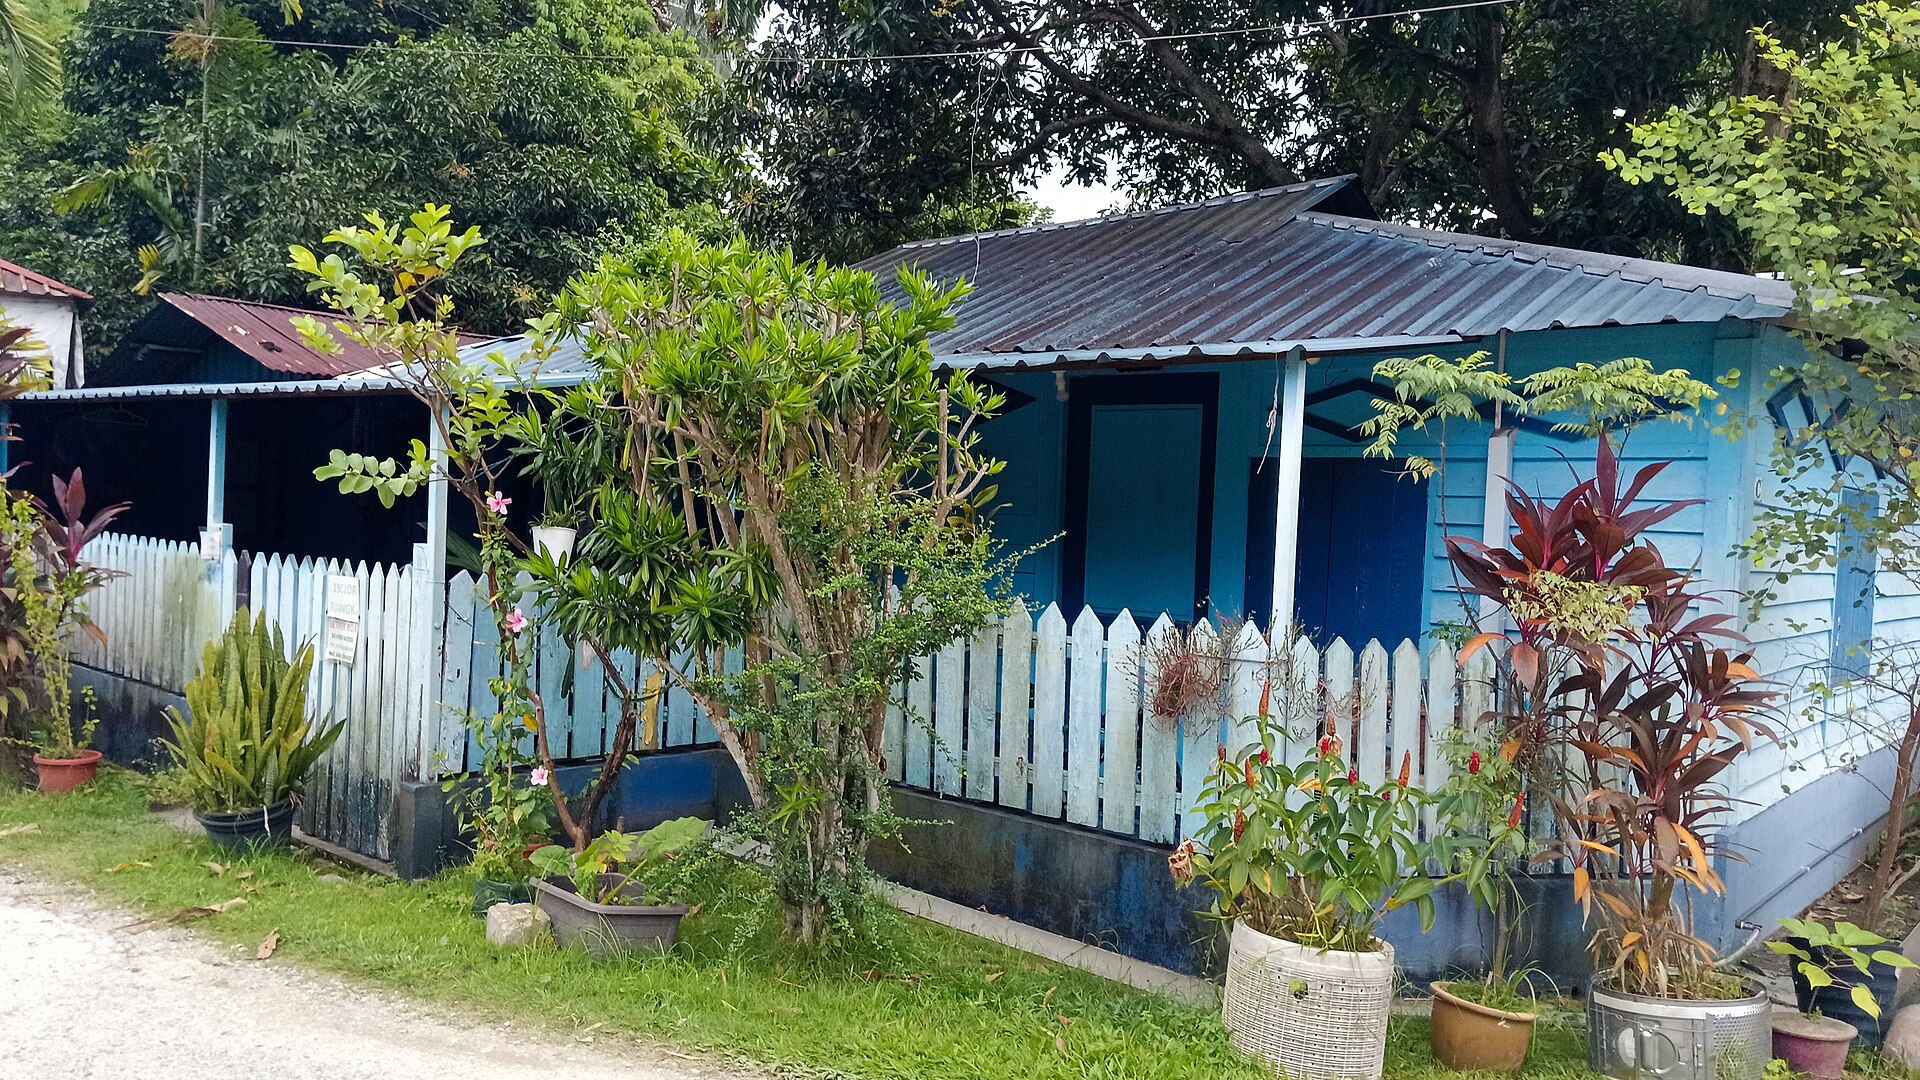
If you own, rent or are watching a unit at The Topiary, the transaction record is the clearest picture you have. It shows what buyers paid, what tenants paid, and how both moved quarter by quarter.
In this article, we look at resales at The Topiary over eight quarters, prices by unit size, rental contracts and gross yield, nearby projects within 1 km, and how our own estimate has performed at this project.
The Topiary is a 99-year EC in District 28 with 85 years of lease left. It recorded 45 resales over Q3 2025 to Q2 2026 at a median of S$1,537 psf, based on URA Data Service caveats.
How Have Resale Prices Moved By Quarter?
The eight quarters from Q3 2024 to Q2 2026 give the longest view in this pack. Each row is a quarterly median, with the counts behind it.
The table and chart below set out the quarterly figures.
Across the eight quarters the quarterly median moved 7.5%, from S$1,420 psf in Q3 2024 to S$1,528 psf in Q2 2026. The table shows the climb was not flat. The median reached S$1,561 psf in Q1 2026 before easing in Q2 2026. Note that the later quarters rest on 10 sales each, so a single large or small unit can shift the middle.
| Quarter | Resales | Median psf | 25th percentile | 75th percentile |
|---|---|---|---|---|
| Q3 2024 | 14 | S$1,420 psf | S$1,378 psf | S$1,435 psf |
| Q4 2024 | 11 | S$1,441 psf | S$1,419 psf | S$1,461 psf |
| Q1 2025 | 17 | S$1,460 psf | S$1,421 psf | S$1,487 psf |
| Q2 2025 | 22 | S$1,459 psf | S$1,436 psf | S$1,481 psf |
| Q3 2025 | 11 | S$1,536 psf | S$1,494 psf | S$1,545 psf |
| Q4 2025 | 14 | S$1,525 psf | S$1,510 psf | S$1,562 psf |
| Q1 2026 | 10 | S$1,561 psf | S$1,538 psf | S$1,596 psf |
| Q2 2026 | 10 | S$1,528 psf | S$1,514 psf | S$1,578 psf |
Which Unit Sizes Traded Most?
Resales at The Topiary over Q3 2025 to Q2 2026 split fairly evenly across three size bands. Prices per square foot sit close together, but total prices do not.
The table below breaks the 45 resales down by size band.
Units of 70 to 89 sqm were the most traded size. There were 16 resales at a median of S$1,389,000, or S$1,518 psf. The 90 to 119 sqm band recorded 15 resales at a median of S$1,680,000. The largest band, 120 sqm and above, saw 14 resales at a median of S$2,100,000. Note that the psf medians run from S$1,518 psf to S$1,552 psf, a narrow spread across all three bands.
| Size band | Resales | Median area | Median price | Median psf |
|---|---|---|---|---|
| 70 to 89 sqm | 16 | 904 sqft | S$1,389,000 | S$1,518 psf |
| 90 to 119 sqm | 15 | 1,087 sqft | S$1,680,000 | S$1,552 psf |
| 120 sqm and above | 14 | 1,351 sqft | S$2,100,000 | S$1,539 psf |
What Were The Highest Prices Paid?
The top end of the window is set by the largest units. The table below lists the five highest resale prices at The Topiary over Q3 2025 to Q2 2026.
The highest price was S$2,955,888 in Q4 2025, for a 2,013 sqft unit on the 21 to 25 storey range at S$1,469 psf. The second entry, a 2,174 sqft unit in Q2 2026, fetched S$2,900,000 at S$1,334 psf. Note that the highest price per square foot in this table is S$1,584 psf, for a 1,389 sqft unit in Q2 2026. Big tickets and high psf are not the same thing here.
| Quarter | Storey range | Area | Price | Per sqft |
|---|---|---|---|---|
| Q4 2025 | 21-25 | 2,013 sqft | S$2,955,888 | S$1,469 psf |
| Q2 2026 | 21-25 | 2,174 sqft | S$2,900,000 | S$1,334 psf |
| Q4 2025 | 01-05 | 1,615 sqft | S$2,308,000 | S$1,429 psf |
| Q2 2026 | 16-20 | 1,389 sqft | S$2,200,000 | S$1,584 psf |
| Q1 2026 | 11-15 | 1,389 sqft | S$2,140,000 | S$1,541 psf |
What Are Rents And The Gross Yield?
Rental approvals lodged with URA give the other half of the picture. The table below shows contracts at The Topiary by quarter.
In Q2 2026 there were 11 rental contracts at S$3.81 psf a month, with a median rent of S$4,000. Against the resale median, our engine measures a gross yield of about 3.1%. The table shows the psf rent slipping from S$4.1 in Q3 2025 to S$3.8 in Q2 2026, while the median monthly rent in Q2 2026 is the highest of the four quarters. Contract counts here run from 8 to 11, so the mix of unit sizes leased each quarter matters.
| Quarter | Contracts | Median rent (S$ psf a month) | Median monthly rent |
|---|---|---|---|
| Q3 2025 | 11 | 4.1 | S$3,900 |
| Q4 2025 | 9 | 3.9 | S$3,800 |
| Q1 2026 | 8 | 4.0 | S$3,800 |
| Q2 2026 | 11 | 3.8 | S$4,000 |
How Does It Compare With The District And Neighbours?
Over the same four quarters, District 28 recorded a resale median of S$1,544 psf from 452 sales. The Topiary sits 0.4% below that figure.
The table below lists resales within 1 km of The Topiary over Q3 2025 to Q2 2026.
High Park Residences recorded the most sales nearby, 61 at a median of S$1,652 psf. Seletar Hills Estate, a 999-year leasehold estate 536 m away, recorded 40 sales at S$1,779 psf. At the other end, Seletar Springs Condominium recorded 11 sales at S$1,043 psf. Note that the table mixes landed and non-landed projects, and tenures from 99-year to 999-year, so the medians are not like for like.
| Project | Tenure | TOP | Distance | Resales | Median psf |
|---|---|---|---|---|---|
| High Park Residences | 99-year leasehold | — | 990 m | 61 | S$1,652 psf |
| Seletar Hills Estate | 999-year leasehold | — | 536 m | 40 | S$1,779 psf |
| Seletar Park Residence | 99-year leasehold | — | 383 m | 17 | S$1,334 psf |
| Luxus Hills | 999-year leasehold | — | 987 m | 16 | S$2,818 psf |
| The Greenwich | 99-year leasehold | — | 348 m | 16 | S$1,348 psf |
| Seletar Springs Condominium | 99-year leasehold | — | 753 m | 11 | S$1,043 psf |
| Tuan Sing Park | 999-year leasehold | — | 674 m | 8 | S$1,423 psf |
| Kelulut Hill | 999-year leasehold | — | 554 m | 4 | S$2,214 psf |
How Accurate Has Our Estimate Been Here?
We test our estimate against sales that happened after it was made. At The Topiary, as of Q4 2025, 36 later sales were tested.
The median error was 4.8%, and 17% of those sales landed inside the stated range. Every figure in this article is indicative and drawn from recorded transactions. None of it is a formal valuation of any home.
Summary
The Topiary recorded 45 resales over Q3 2025 to Q2 2026 at a median of S$1,537 psf, against a District 28 median of S$1,544 psf from 452 sales. The quarterly median moved 7.5% across the eight quarters to Q2 2026, ending at S$1,528 psf. The most traded size band was 70 to 89 sqm, at a median of S$1,389,000. Rents in Q2 2026 ran to a median of S$4,000 a month across 11 contracts, for a gross yield of about 3.1%.
These figures come from URA Data Service caveats and rental contracts, and from our own engine for the yield and the backtest. They tell you what was transacted and lodged, not what any particular unit is worth. Quarterly counts of 10 to 22 sales are small, so the mix of sizes and storeys in a given quarter can move the median on its own.
Method: URA resale caveats at the project (developer sales and sub-sales excluded) by the quarter of the sale month. Size bands by caveated floor area. Rents are URA rental contracts at the project, and the gross yield is the mean of the quarterly median rents per square foot, annualised, over the four-quarter resale median per square foot, before any cost. Lease left is the tenure less the years since the lease started, as recorded. The estimate accuracy is this site's backtest: the engine run as of the quarter named, compared with the sales since. Private figures are from URA Data Service caveats, HDB figures from data.gov.sg resale records, both loaded weekly by this site's ingest. Medians are of the non-excluded transactions in the period named. Sales flagged by the hygiene rules (related-party transfers, bulk deals, outliers) are left out. Every figure is indicative and drawn from recorded transactions, not a formal valuation.