Terra Hill By The Numbers, September 2026: 190 Units Sold At A Median Of S$2,687 psf
Published 23 Oct 2026 · Terra Hill
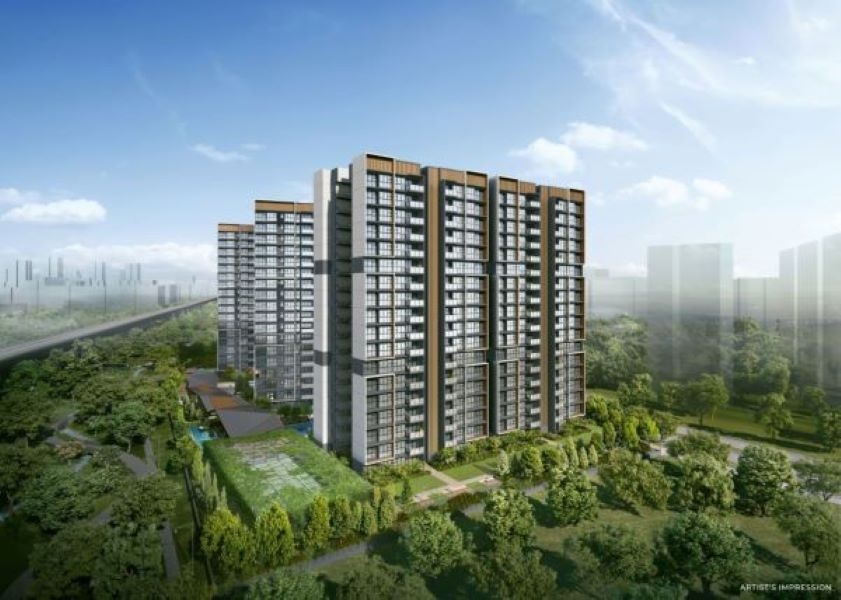
If you are watching the freehold stretch around Pasir Panjang, Terra Hill is one of the clearest records of what buyers have paid there since 2023. The project sits in District 5 and has 270 units.
In this article, we look at how Terra Hill has sold month by month. We also look at prices by unit size, resales within a kilometre, and the other District 5 launches selling over the past year.
The project has recorded 190 developer sales since February 2023, at an overall median of S$2,687 psf. That is 70.4% of its units, based on URA Data Service caveats.
How Many Units Have Sold Each Month?
Sales started in February 2023 and have run for 37 months. The table and chart below show the caveat count and median psf for every month with a sale.
The table shows February 2023 as the busiest month, with 63 caveats. After that, most months recorded between one and four sales. Activity picked up again in 2026, with 11 caveats in March 2026, seven in May 2026 and seven in June 2026.
September 2026 recorded 16 caveats, the second-highest monthly count on record. Its median of S$2,324 psf is the lowest monthly median in the table. That is -13.9% from the first month's median of S$2,699 psf. Note that monthly medians cover few units in most months, so unit mix can move them.
| Month | Caveats | Cumulative | Median psf |
|---|---|---|---|
| February 2023 | 63 | 63 | S$2,699 psf |
| March 2023 | 1 | 64 | S$2,790 psf |
| April 2023 | 2 | 66 | S$2,673 psf |
| May 2023 | 3 | 69 | S$2,634 psf |
| June 2023 | 2 | 71 | S$2,718 psf |
| July 2023 | 2 | 73 | S$2,744 psf |
| August 2023 | 2 | 75 | S$2,700 psf |
| September 2023 | 3 | 78 | S$2,744 psf |
| December 2023 | 1 | 79 | S$2,622 psf |
| January 2024 | 1 | 80 | S$2,713 psf |
| February 2024 | 1 | 81 | S$2,844 psf |
| April 2024 | 4 | 85 | S$2,717 psf |
| June 2024 | 1 | 86 | S$2,568 psf |
| July 2024 | 1 | 87 | S$2,734 psf |
| November 2024 | 3 | 90 | S$2,638 psf |
| December 2024 | 2 | 92 | S$2,717 psf |
| January 2025 | 3 | 95 | S$2,601 psf |
| February 2025 | 4 | 99 | S$2,668 psf |
| March 2025 | 2 | 101 | S$2,771 psf |
| April 2025 | 1 | 102 | S$2,596 psf |
| May 2025 | 4 | 106 | S$2,671 psf |
| June 2025 | 4 | 110 | S$2,773 psf |
| July 2025 | 3 | 113 | S$2,748 psf |
| August 2025 | 4 | 117 | S$2,639 psf |
| September 2025 | 4 | 121 | S$2,746 psf |
| October 2025 | 4 | 125 | S$2,687 psf |
| November 2025 | 4 | 129 | S$2,596 psf |
| December 2025 | 1 | 130 | S$2,601 psf |
| January 2026 | 5 | 135 | S$2,653 psf |
| February 2026 | 4 | 139 | S$2,695 psf |
| March 2026 | 11 | 150 | S$2,691 psf |
| April 2026 | 3 | 153 | S$2,737 psf |
| May 2026 | 7 | 160 | S$2,690 psf |
| June 2026 | 7 | 167 | S$2,654 psf |
| July 2026 | 5 | 172 | S$2,726 psf |
| August 2026 | 2 | 174 | S$2,482 psf |
| September 2026 | 16 | 190 | S$2,324 psf |
What Have Buyers Paid By Unit Size?
Caveats split into four size bands. The table below gives the count, median area, median price and median psf for each.
The 90 to 119 sqm band was the most sold, with 64 caveats at a median of S$2,909,000, or S$2,665 psf. The 70 to 89 sqm band followed with 59 caveats at a median of S$2,260,000. That band also carries the highest median psf in the table, at S$2,728 psf.
At the larger end, 49 caveats fell in the 120 sqm and above band, at a median area of 1,851 sqft and a median price of S$3,982,000. The smallest band, 50 to 69 sqm, had 18 caveats at a median of S$1,801,000.
| Size band | Caveats | Median area | Median price | Median psf |
|---|---|---|---|---|
| 50 to 69 sqm | 18 | 678 sqft | S$1,801,000 | S$2,656 psf |
| 70 to 89 sqm | 59 | 807 sqft | S$2,260,000 | S$2,728 psf |
| 90 to 119 sqm | 64 | 1,087 sqft | S$2,909,000 | S$2,665 psf |
| 120 sqm and above | 49 | 1,851 sqft | S$3,982,000 | S$2,665 psf |
How Does It Compare With Resales Nearby?
Within 1,000 m of Terra Hill, 240 resales across 39 completed projects were recorded in the 24 months to September 2026. Their median was S$1,941 psf. The launch median is +38.5% against that figure.
The table below lists the nearby projects with the most resales.
Normanton Park recorded the most resales at 72, at a median of S$2,012 psf, from 841 m away. Kent Ridge Hill Residences is the closest of the busier projects at 306 m, with 49 resales at S$1,985 psf. Note that several of the freehold projects listed have single-digit resale counts, so their medians rest on very few transactions.
| Project | Tenure | TOP | Distance | Resales | Median psf |
|---|---|---|---|---|---|
| Normanton Park | 99-year leasehold | — | 841 m | 72 | S$2,012 psf |
| Kent Ridge Hill Residences | 99-year leasehold | — | 306 m | 49 | S$1,985 psf |
| Viva Vista | freehold | — | 766 m | 18 | S$1,727 psf |
| The Verandah Residences | freehold | — | 892 m | 16 | S$2,031 psf |
| The Maylea | freehold | — | 831 m | 9 | S$1,683 psf |
| Mendon Spring | freehold | — | 554 m | 7 | S$1,280 psf |
| Island View | freehold | — | 115 m | 6 | S$1,365 psf |
| Harbour View Gardens | freehold | — | 822 m | 5 | S$1,917 psf |
Other Launches In District 5
Terra Hill is not the only project selling in the district. The table below covers developer sales at other District 5 launches over the 12 months to September 2026.
Faber Residence sold the most, with 220 caveats at a median of S$2,162 psf. Hudson Place Residences followed with 192 caveats at S$2,486 psf, and Bloomsbury Residences with 114 caveats at S$2,561 psf.
All of these are 99-year leasehold except The Hillshore, which is freehold and recorded seven caveats at S$2,343 psf. Tenure and expected TOP differ across the list, so the medians are not like for like.
| Project | Tenure | Expected TOP | Caveats | Median psf |
|---|---|---|---|---|
| Faber Residence | 99-year leasehold | 2,028 | 220 | S$2,162 psf |
| Hudson Place Residences | 99-year leasehold | 2,029 | 192 | S$2,486 psf |
| Bloomsbury Residences | 99-year leasehold | 2,028 | 114 | S$2,561 psf |
| Elta | 99-year leasehold | — | 79 | S$2,566 psf |
| Blossoms By The Park | 99-year leasehold | — | 11 | S$2,397 psf |
| The Hillshore | freehold | — | 7 | S$2,343 psf |
| Lyndenwoods | 99-year leasehold | 2,028 | 7 | S$2,516 psf |
| The Hill @One-North | 99-year leasehold | — | 6 | S$2,450 psf |
Summary
Terra Hill has sold 190 of 270 units since February 2023, 23 of them in the three months to September 2026, at an overall median of S$2,687 psf. The 90 to 119 sqm band accounts for the largest share of caveats at 64. Resales within 1 km over the past 24 months had a median of S$1,941 psf, and the launch median sits +38.5% above that.
These figures are indicative and come from recorded transactions, not from any formal valuation. They show what was paid and when, by month and by size band. They cannot tell you which stacks, floors or facings those caveats covered, and monthly medians built on a handful of sales can move on mix alone.
Method: URA caveats for developer sales ('new sale') at the project, dated to the month. Size bands by the caveated floor area. The nearby comparison is resale caveats in completed projects within one kilometre over 24 months, unadjusted for size, age or floor. Units sold is the caveat count, which lags option exercises by weeks. Private figures are from URA Data Service caveats, HDB figures from data.gov.sg resale records, both loaded weekly by this site's ingest. Medians are of the non-excluded transactions in the period named. Sales flagged by the hygiene rules (related-party transfers, bulk deals, outliers) are left out. Every figure is indicative and drawn from recorded transactions, not a formal valuation.