Residential Apartments: 44 Resales From Q3 2025 To Q2 2026 At A Median Of S$1,483 psf
Published 7 Oct 2026 · Residential Apartments
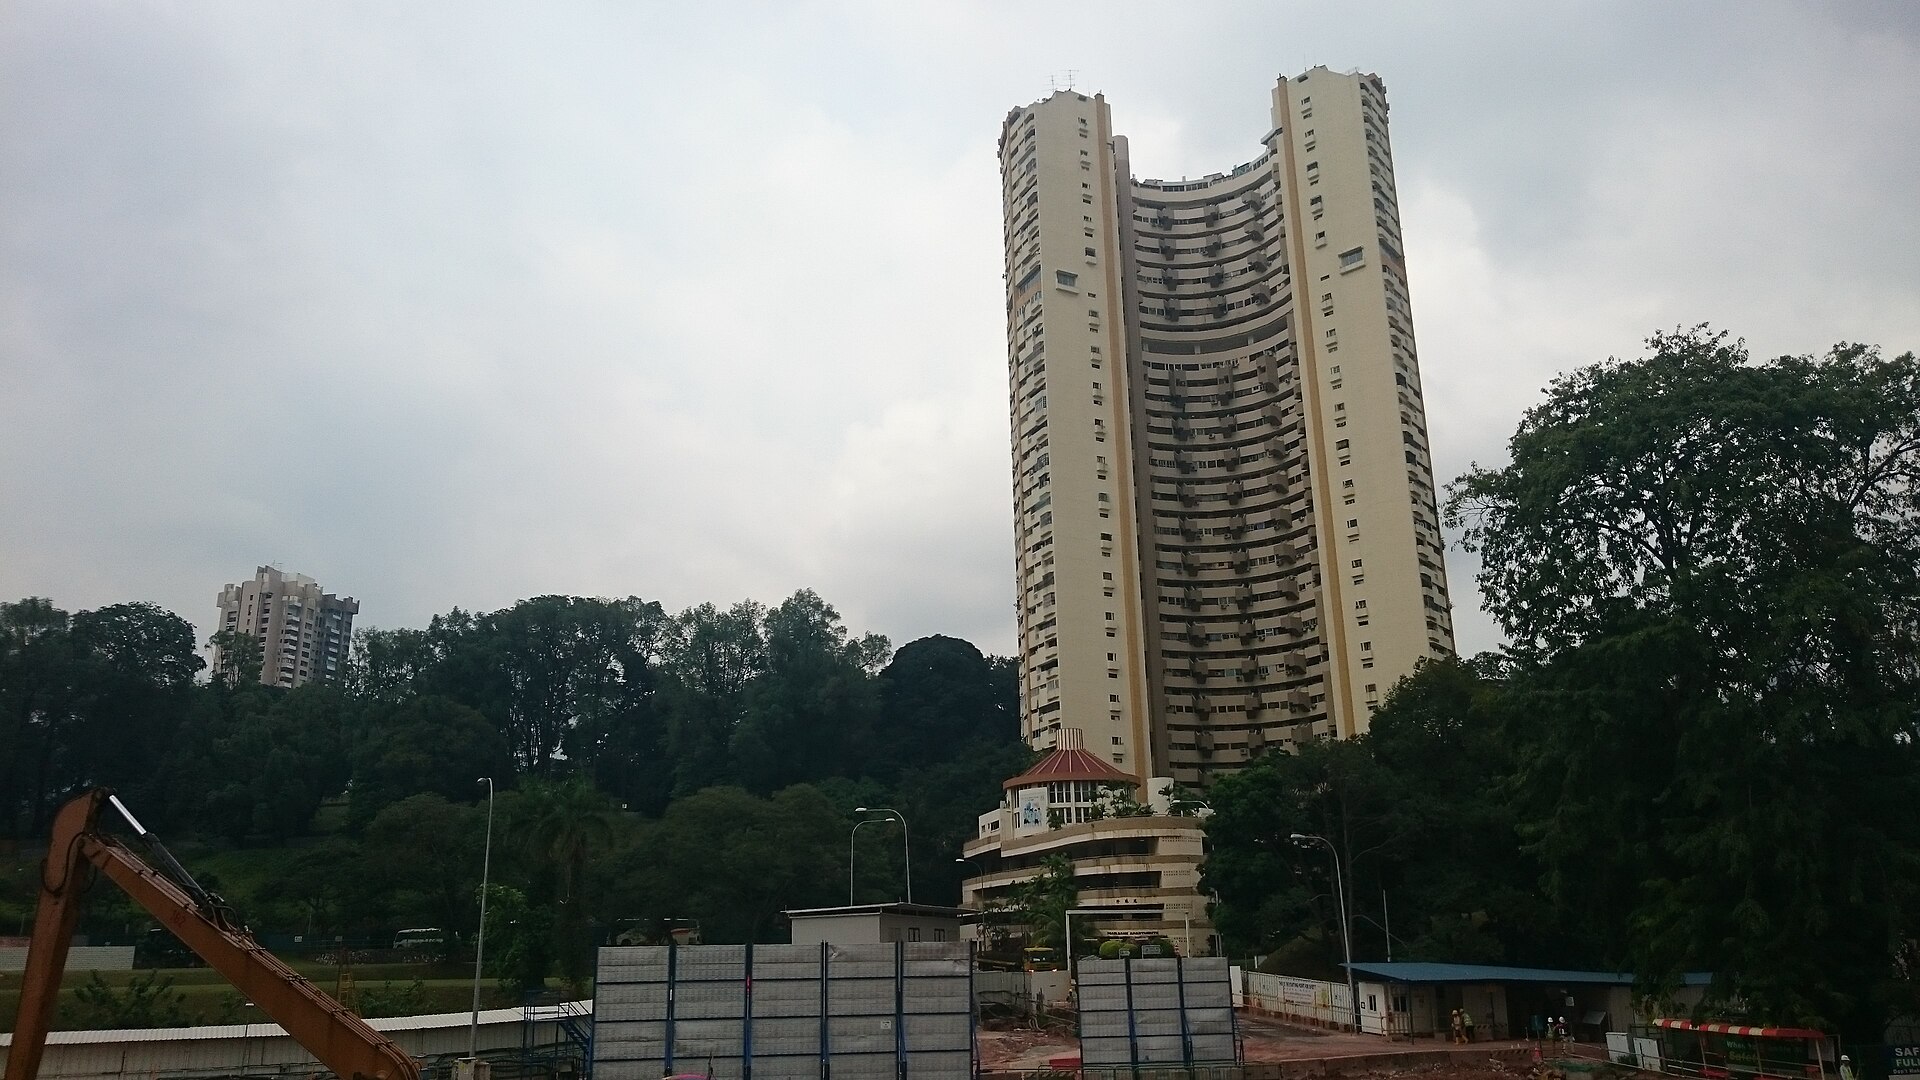
If you own a unit at Residential Apartments, or you have been tracking the project, the question is usually the same. What are units there actually changing hands at, and how does that sit against the rest of the district?
In this article, we look at eight quarters of resales at Residential Apartments, the split by unit size, the biggest prices in the window, and how nearby projects traded over the same period. We also show how this site's own estimate performed against later sales there.
The project is a 304-unit apartment development in District 3, with 9,936 years of lease remaining. It recorded 44 resales over Q3 2025 to Q2 2026 at a median of S$1,483 psf, based on caveat data from the URA Data Service.
How Have Prices Moved Across The Last Eight Quarters?
Quarterly medians at a single project move around a lot, because each quarter rests on a small number of sales. The table and chart below show the median psf for each of the eight quarters, along with the 25th and 75th percentiles.
Across the eight quarters shown, the quarterly resale median moved -2.5%, from S$1,476 psf in Q3 2024 to S$1,439 psf in Q2 2026. The high point was Q1 2025 at S$1,696 psf from 10 sales, and the low was Q4 2024 at S$1,293 psf from 12 sales.
Note how wide the percentile band runs. In Q2 2026, the 25th percentile sat at S$1,364 psf and the 75th at S$1,943 psf, on 14 sales. That spread tells you the project trades across a broad range of psf levels in the same quarter.
| Quarter | Resales | Median psf | 25th percentile | 75th percentile |
|---|---|---|---|---|
| Q3 2024 | 9 | S$1,476 psf | S$1,275 psf | S$1,935 psf |
| Q4 2024 | 12 | S$1,293 psf | S$1,199 psf | S$1,794 psf |
| Q1 2025 | 10 | S$1,696 psf | S$1,523 psf | S$1,729 psf |
| Q2 2025 | 14 | S$1,638 psf | S$1,455 psf | S$1,898 psf |
| Q3 2025 | 7 | S$1,491 psf | S$1,353 psf | S$2,153 psf |
| Q4 2025 | 13 | S$1,467 psf | S$1,334 psf | S$1,700 psf |
| Q1 2026 | 10 | S$1,569 psf | S$1,386 psf | S$2,006 psf |
| Q2 2026 | 14 | S$1,439 psf | S$1,364 psf | S$1,943 psf |
Which Unit Sizes Traded Most?
The 44 resales in the window were not spread evenly across sizes. The table below groups them into four size bands, with the median area, median price and median psf for each.
Units of 120 sqm and above were the most traded band, with 28 resales at a median of S$2,580,000, or S$1,502 psf on a median area of 1,496 sqft. The 90 to 119 sqm band followed with 14 resales at a median of S$1,596,500, or S$1,436 psf.
The two smaller bands each recorded a single resale. A 732 sqft unit transacted at S$1,880,000, or S$2,568 psf, and an 883 sqft unit at S$1,800,000, or S$2,039 psf. One sale is not a trend, so read those two rows as individual transactions rather than a level for the band.
| Size band | Resales | Median area | Median price | Median psf |
|---|---|---|---|---|
| 50 to 69 sqm | 1 | 732 sqft | S$1,880,000 | S$2,569 psf |
| 70 to 89 sqm | 1 | 883 sqft | S$1,800,000 | S$2,039 psf |
| 90 to 119 sqm | 14 | 1,136 sqft | S$1,596,500 | S$1,436 psf |
| 120 sqm and above | 28 | 1,496 sqft | S$2,580,000 | S$1,502 psf |
The Highest Resale Prices In The Window
Large units pull the top of the price range well above the project median. The table below lists the five highest resale prices recorded over Q3 2025 to Q2 2026.
The highest was S$15,800,000 in Q3 2025, for a 6,051 sqft unit on the 01-05 storey range, working out to S$2,611 psf. The next highest was S$4,320,000 in Q2 2026 for a 2,046 sqft unit, at S$2,111 psf.
Three of the five were 1,798 sqft units, across Q4 2025 and Q1 2026, at between S$3,800,000 and S$4,260,000. The one at S$2,370 psf came from the 11-15 storey range, the highest floor band in the list.
| Quarter | Storey range | Area | Price | Per sqft |
|---|---|---|---|---|
| Q3 2025 | 01-05 | 6,051 sqft | S$15,800,000 | S$2,611 psf |
| Q2 2026 | 01-05 | 2,046 sqft | S$4,320,000 | S$2,111 psf |
| Q4 2025 | 11-15 | 1,798 sqft | S$4,260,000 | S$2,370 psf |
| Q4 2025 | 06-10 | 1,798 sqft | S$3,800,000 | S$2,114 psf |
| Q1 2026 | 01-05 | 1,798 sqft | S$3,800,000 | S$2,114 psf |
How Does It Compare With The District And Nearby Projects?
Over the same four quarters, the District 3 resale median was S$2,216 psf from 614 sales. Residential Apartments sits -33.1% against that figure. Unit size and mix differ across a district, so the gap is a comparison of medians rather than a like-for-like measure.
The table below lists resales within 1 km of the project over Q3 2025 to Q2 2026, by project.
The Springside, 388 m away, recorded the most activity with 21 resales at a median of S$2,414 psf. Springleaf Garden, at 435 m, had 14 resales at S$1,463 psf, and The Essence, a 99-year leasehold project 357 m away, had 7 at S$1,477 psf. The highest nearby median was Mandai Garden at S$2,760 psf, though that rests on just 5 sales.
| Project | Tenure | TOP | Distance | Resales | Median psf |
|---|---|---|---|---|---|
| The Springside | freehold | — | 388 m | 21 | S$2,414 psf |
| Springleaf Garden | freehold | — | 435 m | 14 | S$1,463 psf |
| The Essence | 99-year leasehold | — | 357 m | 7 | S$1,477 psf |
| Mandai Garden | 999-year leasehold | — | 535 m | 5 | S$2,760 psf |
| Dalla Vale | freehold | — | 616 m | 4 | S$993 psf |
| The Brooks Ii | freehold | — | 422 m | 3 | S$1,552 psf |
| Heeton Park | freehold | — | 257 m | 2 | S$2,048 psf |
| Landed, Meng Suan Road | 999-year leasehold | — | 498 m | 2 | S$2,084 psf |
How Accurate Has Our Estimate Been Here?
We test this site's estimate against sales that happened after it was produced. As of Q4 2025, it was tested against 44 later sales at Residential Apartments.
The median error was 17.3%, and 52% of those sales landed inside the stated range. That is a wide error band, and it reflects the spread seen in the quarterly percentiles and the mix of unit sizes at the project. Every figure here is indicative and drawn from recorded transactions, not a valuation of any home.
Summary
Residential Apartments recorded 44 resales over Q3 2025 to Q2 2026 at a median of S$1,483 psf. The quarterly median moved -2.5% across eight quarters, from S$1,476 psf in Q3 2024 to S$1,439 psf in Q2 2026. Units of 120 sqm and above made up 28 of the 44 resales, at a median of S$2,580,000. Against the District 3 median of S$2,216 psf from 614 sales, the project sits -33.1%.
These figures come from recorded caveats, so they tell you what units transacted at, not what any particular unit is worth. Quarterly counts here run between 7 and 14 sales, which is small enough that mix alone can move a median. Our own estimate had a median error of 17.3% when tested against 44 later sales at the project.
Method: URA resale caveats at the project (developer sales and sub-sales excluded) by the quarter of the sale month. Size bands by caveated floor area. Rents are URA rental contracts at the project, and the gross yield is the mean of the quarterly median rents per square foot, annualised, over the four-quarter resale median per square foot, before any cost. Lease left is the tenure less the years since the lease started, as recorded. The estimate accuracy is this site's backtest: the engine run as of the quarter named, compared with the sales since. Private figures are from URA Data Service caveats, HDB figures from data.gov.sg resale records, both loaded weekly by this site's ingest. Medians are of the non-excluded transactions in the period named. Sales flagged by the hygiene rules (related-party transfers, bulk deals, outliers) are left out. Every figure is indicative and drawn from recorded transactions, not a formal valuation.