88 Resales At Affinity At Serangoon At A Median Of S$1,853 Psf — But Its Largest Units Fetched The Lowest Psf
Published 29 Sept 2026 · Affinity At Serangoon
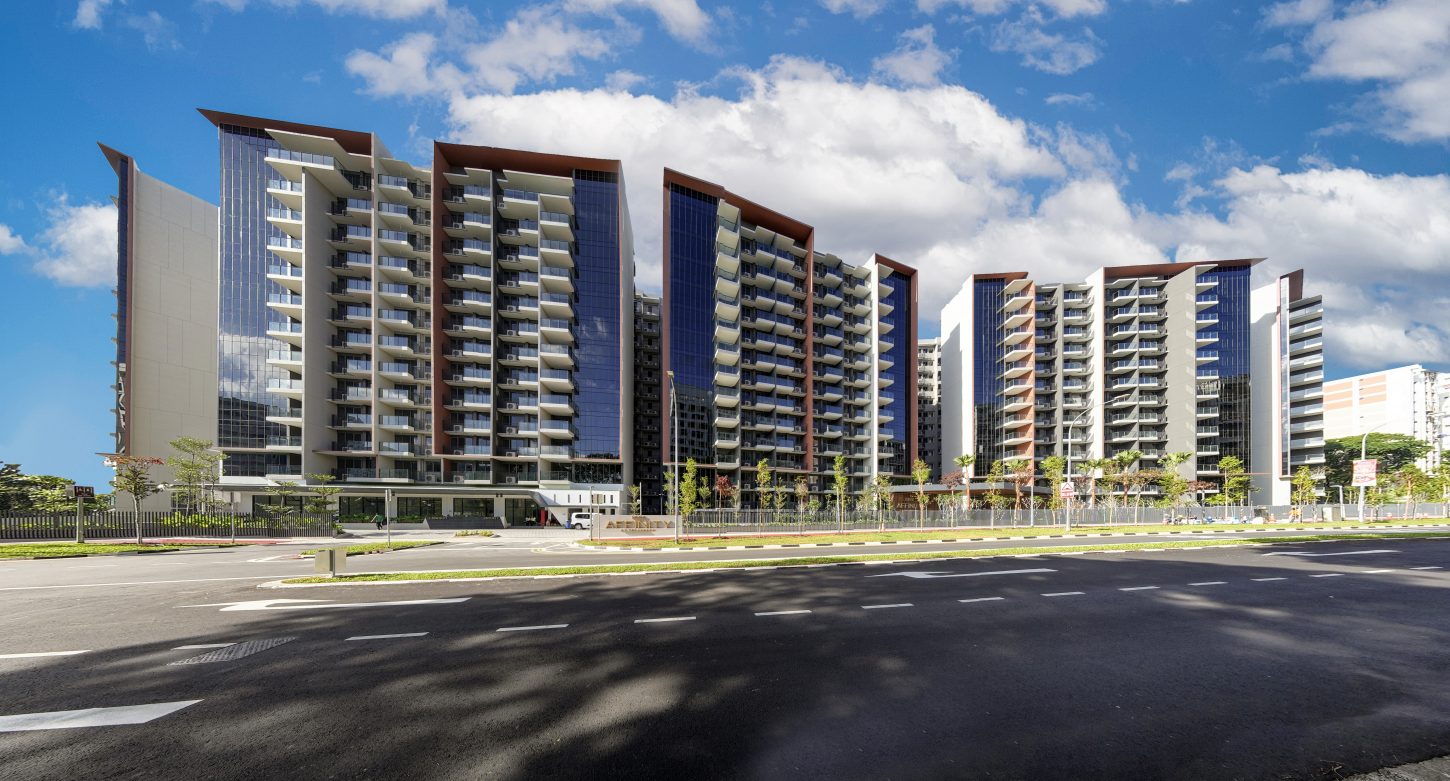
A project median can climb across a year and still slip in its most recent quarter. Affinity At Serangoon does both at the same time. The size bands add a second wrinkle. The biggest units carry the biggest prices, but not the highest psf.
According to URA Data Service caveats, the project recorded 88 resales over Q3 2025 to Q2 2026 at a median of S$1,853 psf. It is a 99-year leasehold apartment project in District 19, with 91 years of lease left. Across the five quarters on record, the quarterly median moved +6.4%. That runs from S$1,722 psf in 2Q2025, on three sales, to S$1,832 psf in 2Q2026, on eleven. We pulled the quarterly table, the size bands, the rental contracts and the nearby projects. Here is what stood out to us.
The latest quarter came in below the two peak quarters of late 2025
The quarterly path is not a straight line. The median sat at S$1,722 psf in 2Q2025, but only three sales sit behind it. Volume then jumped. There were 32 resales in 3Q2025 at S$1,875 psf, and 25 in 4Q2025 at S$1,876 psf. The median then eased to S$1,848 psf in 1Q2026 on 20 sales. In 2Q2026 it was S$1,832 psf on 11 sales. So the +6.4% headline move is measured from a three-sale quarter. That is worth keeping in mind. A median built on three transactions can swing on unit mix alone, and it tells you little about the project as a whole.
The quartile columns give more texture. In 2Q2026 the spread ran from S$1,681 psf at the lower quartile to S$1,944 psf at the upper. In 4Q2025 the same columns read S$1,763 psf and S$1,928 psf. Both quarters have a similar median. The transactions underneath them do not look the same. With eleven sales in the latest quarter, one large or one small unit can shift the middle figure.
The quarterly table and the line chart below show the full run.
| Quarter | Resales | Median psf | 25th percentile | 75th percentile |
|---|---|---|---|---|
| Q2 2025 | 3 | S$1,722 psf | S$1,704 psf | S$1,798 psf |
| Q3 2025 | 32 | S$1,875 psf | S$1,733 psf | S$1,928 psf |
| Q4 2025 | 25 | S$1,876 psf | S$1,763 psf | S$1,928 psf |
| Q1 2026 | 20 | S$1,848 psf | S$1,707 psf | S$1,889 psf |
| Q2 2026 | 11 | S$1,832 psf | S$1,681 psf | S$1,944 psf |
The most traded size band also carries the lowest psf in the project
Units of 50 to 69 sqm were the most traded size over the window. There were 32 resales at a median of S$1,036,500, which works out to S$1,733 psf. That is the lowest median psf of the five bands. The smallest units, under 50 sqm, did better on a psf basis. Ten resales there posted a median of S$840,000 at S$1,774 psf. Usually the smaller band prices higher per square foot. Here the order is reversed between those two.
The strongest psf sits in the middle of the range. The 70 to 89 sqm band recorded 17 resales at a median of S$1,680,000, or S$1,952 psf. The 90 to 119 sqm band was close behind, with 16 resales at S$2,193,444 and S$1,919 psf. Then it drops again. The 120 sqm and above band logged 13 resales at a median of S$3,030,000, or S$1,824 psf.
So the top of the project by price is not the top by psf. The table below sets the bands side by side.
| Size band | Resales | Median area | Median price | Median psf |
|---|---|---|---|---|
| under 50 sqm | 10 | 474 sqft | S$840,000 | S$1,774 psf |
| 50 to 69 sqm | 32 | 614 sqft | S$1,036,500 | S$1,733 psf |
| 70 to 89 sqm | 17 | 850 sqft | S$1,680,000 | S$1,952 psf |
| 90 to 119 sqm | 16 | 1,152 sqft | S$2,193,444 | S$1,919 psf |
| 120 sqm and above | 13 | 1,668 sqft | S$3,030,000 | S$1,824 psf |
Median rent slipped to S$2,900 in 2Q2026 after three quarters at S$3,000
Rental activity here is heavy relative to resale volume. URA recorded 68 contracts in 3Q2025, then 94 in 4Q2025, 80 in 1Q2026 and 65 in 2Q2026. The median monthly rent held at S$3,000 for three straight quarters. In 2Q2026 it came in at S$2,900. On a per-area basis the drift is steadier. The median moved from 5.5 psf a month in 3Q2025 to 5.4 in 4Q2025, then 5.3 in both 1Q2026 and 2Q2026.
Set the 2Q2026 rental median of S$5.27 psf a month against the resale median, and our engine measures a gross yield of about 3.5%. That figure is indicative. It comes from recorded contracts and recorded caveats, not from any valuation. It also takes no account of the unit mix on either side. The flats being leased are not necessarily the flats being sold.
The rental table below shows the four quarters of contracts.
| Quarter | Contracts | Median rent (S$ psf a month) | Median monthly rent |
|---|---|---|---|
| Q3 2025 | 68 | 5.5 | S$3,000 |
| Q4 2025 | 94 | 5.4 | S$3,000 |
| Q1 2026 | 80 | 5.3 | S$3,000 |
| Q2 2026 | 65 | 5.3 | S$2,900 |
The project prices above its district median but below three of its nearest neighbours
Over the same four quarters, District 19 recorded 2,311 resales at a median of S$1,644 psf. Affinity At Serangoon sits +12.8% against that figure. The picture narrows once you look within a kilometre. Serangoon Garden Estate, 431 m away, logged 87 resales at S$2,039 psf on a 999-year leasehold. Hundred Palms Residences, 966 m out, recorded 54 resales at S$1,903 psf. The Garden Residences, the closest of the larger sets at 341 m, posted 44 resales at S$1,895 psf.
Below the project's own median sit several others. Terrasse recorded 19 resales at S$1,572 psf. The Waterline, a freehold project 404 m away, had six resales at S$1,470 psf, and 3@Sandilands five at S$1,308 psf. Parry Park is the highest of the group at S$2,399 psf, but on six sales only.
Tenure, age and unit mix all differ across these projects, and the table does not control for any of them. Several of the counts are in single digits. Read those medians loosely. The nearby projects are listed below.
| Project | Tenure | TOP | Distance | Resales | Median psf |
|---|---|---|---|---|---|
| Serangoon Garden Estate | 999-year leasehold | — | 431 m | 87 | S$2,039 psf |
| Hundred Palms Residences | 99-year leasehold | — | 966 m | 54 | S$1,903 psf |
| The Garden Residences | 99-year leasehold | — | 341 m | 44 | S$1,895 psf |
| Terrasse | 99-year leasehold | — | 568 m | 19 | S$1,572 psf |
| Park Villas | 99-year leasehold | — | 782 m | 6 | S$1,712 psf |
| Parry Park | 999-year leasehold | — | 712 m | 6 | S$2,399 psf |
| The Waterline | freehold | — | 404 m | 6 | S$1,470 psf |
| 3@Sandilands | 999-year leasehold | — | 722 m | 5 | S$1,309 psf |
The largest cheques in the window came with some of the lowest psf figures
The top price over the four quarters was S$3,400,000 in 3Q2025, for a 2,336 sqft unit at S$1,456 psf. Next came S$3,325,000 in 1Q2026, for 2,347 sqft at S$1,417 psf. A third large unit, also 2,336 sqft, changed hands at S$3,260,000 in 3Q2025, or S$1,396 psf. A fourth, 2,303 sqft, went for S$3,150,000 in 4Q2025 at S$1,368 psf.
Every one of those psf figures sits below the project median for the window. The exception in the group is a 1,711 sqft unit on the 11 to 15 storey band. It sold for S$3,200,022 in 4Q2025, at S$1,870 psf. That is the only entry in the list with a storey range recorded.
This is the same pattern the size bands showed, seen one transaction at a time. Large-format units absorb a high total price and a lower rate per square foot. Five sales cannot settle much on their own. The top resales are listed below.
| Quarter | Storey range | Area | Price | Per sqft |
|---|---|---|---|---|
| Q3 2025 | - | 2,336 sqft | S$3,400,000 | S$1,456 psf |
| Q1 2026 | - | 2,347 sqft | S$3,325,000 | S$1,417 psf |
| Q3 2025 | - | 2,336 sqft | S$3,260,000 | S$1,396 psf |
| Q4 2025 | 11-15 | 1,711 sqft | S$3,200,022 | S$1,870 psf |
| Q4 2025 | - | 2,303 sqft | S$3,150,000 | S$1,368 psf |
Our estimate landed within 3.2% of the typical sale here, but only a fifth fell inside the stated range
We also test our own estimate against what actually transacted. As of 4Q2025, 62 later sales at Affinity At Serangoon had been checked against it. The median error was 3.2%. That is the middle miss, not the worst one. Half the sales were further out than that.
The second figure matters more for how you read any single number. Only 21% of those sales fell inside the range we stated. The central estimate tracks the project reasonably well. The band around it was too narrow for most transactions here. That fits a project where psf varies widely by size band, from S$1,733 psf to S$1,952 psf across the four quarters.
None of this is a valuation of any home. It is a measured figure from recorded transactions, tested against later recorded transactions.
In pictures
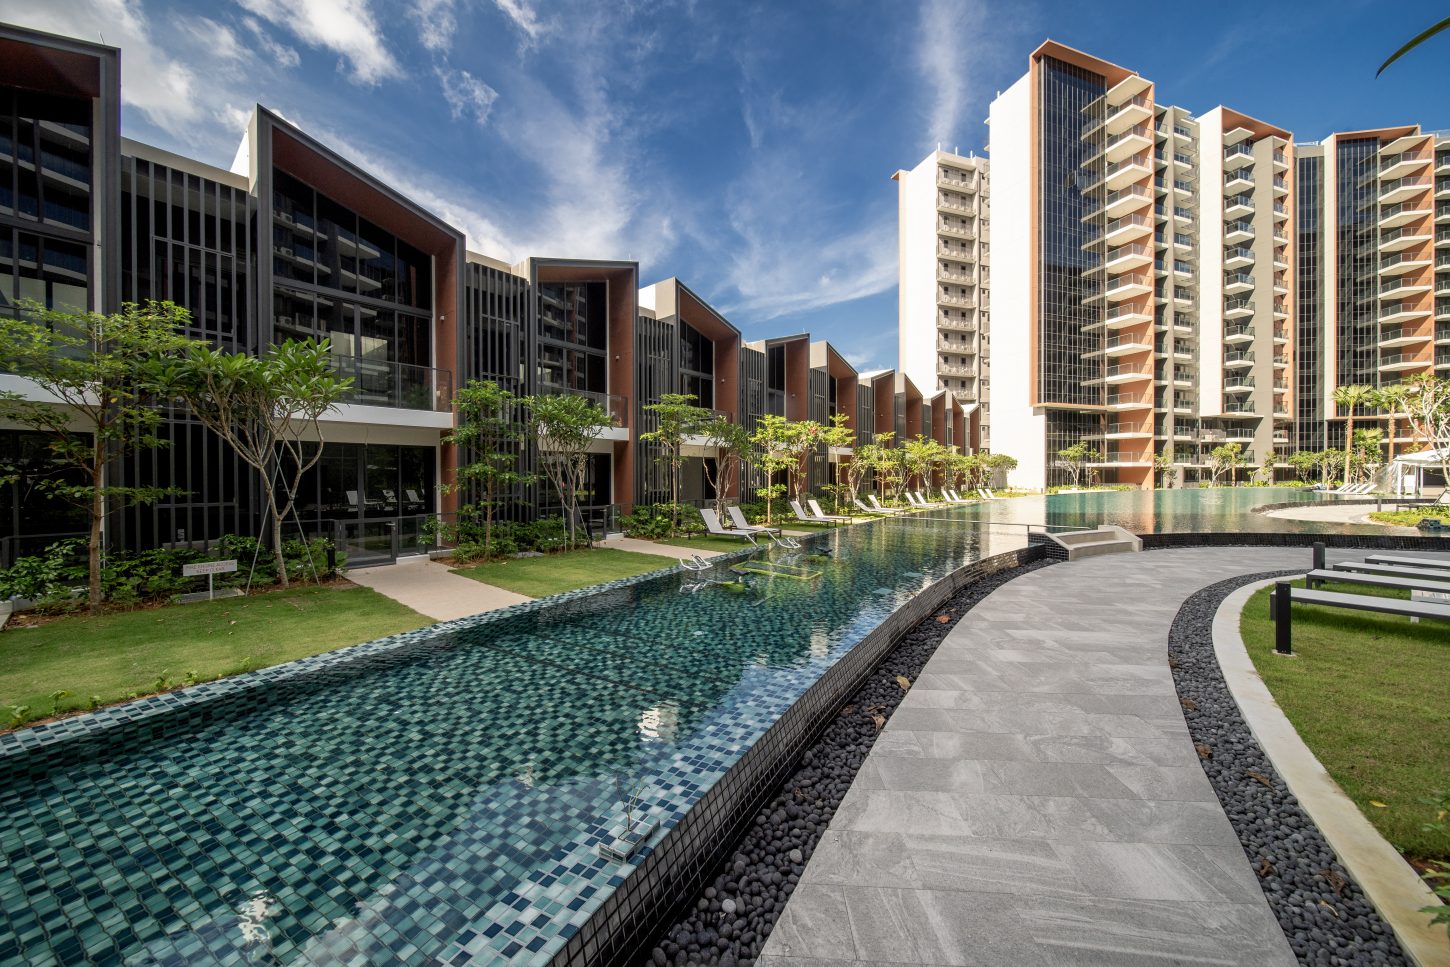
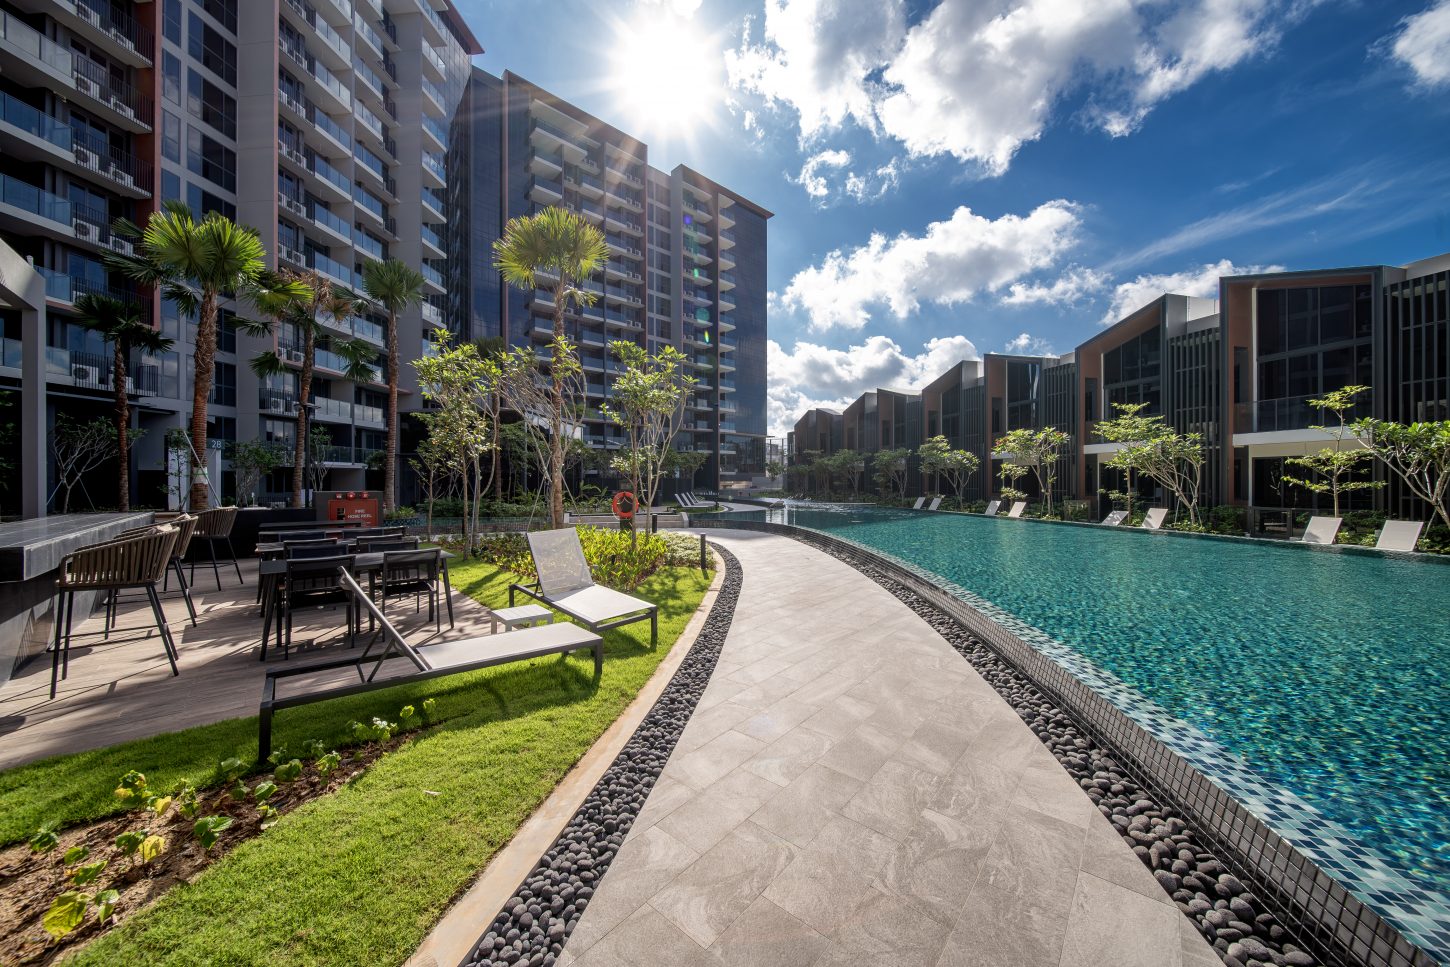
Several things stay open. The 2Q2026 median rests on 11 sales, against 32 in 3Q2025. A count that small moves easily with unit mix. The next quarter's caveats will show whether the median holds near S$1,832 psf or returns to the late-2025 range. The rental side is worth tracking too. Median rent stepped down to S$2,900 after three quarters at S$3,000, while the per-area median held at 5.3 psf a month. Whether that is a shift in the size of units being leased, or a shift in rates, the current table cannot separate.
One quarter of medians rarely settles anything. What it does is add a point to a line. Here that line runs across five quarters of resales, four quarters of rental contracts and a set of neighbouring projects. The interesting part is not the headline figure. It is that the same project reads as rising and easing depending on where you start, and that its largest units price lowest per square foot. Both facts come from the same 88 transactions.
Method: URA resale caveats at the project (developer sales and sub-sales excluded) by the quarter of the sale month. Size bands by caveated floor area. Rents are URA rental contracts at the project, and the gross yield is the mean of the quarterly median rents per square foot, annualised, over the four-quarter resale median per square foot, before any cost. Lease left is the tenure less the years since the lease started, as recorded. The estimate accuracy is this site's backtest: the engine run as of the quarter named, compared with the sales since. Private figures are from URA Data Service caveats, HDB figures from data.gov.sg resale records, both loaded weekly by this site's ingest. Medians are of the non-excluded transactions in the period named. Sales flagged by the hygiene rules (related-party transfers, bulk deals, outliers) are left out. Every figure is indicative and drawn from recorded transactions, not a formal valuation.