Midwood Resales Hold Near $1,919 psf Across 53 Sales — And The Median Sits +29.1% Above The District
Published 18 Nov 2026 · Midwood
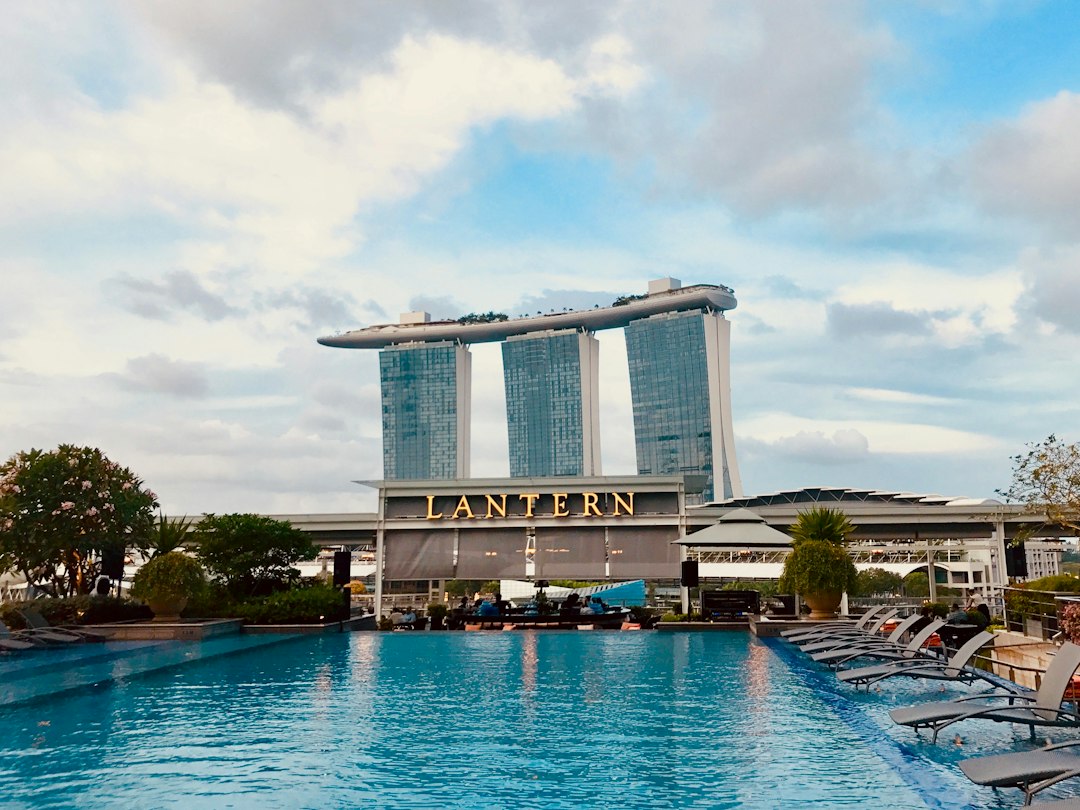
Midwood's resale prices have stayed in a fairly tight band for most of the past two years. Yet the project now trades above both its district and every condo we checked within 1 km. That gap is the main tension in this profile. We also looked at how thin some of the quarterly counts are, because a headline median is only as firm as the sales behind it. Here's what stood out to us.
According to URA Data Service caveats, Midwood is a 99-year condo in District 23 with 91 years of lease left. It recorded 53 resales over 4Q2025 to 3Q2026 at a median of $1,919 psf. Across the eight quarters shown, the quarterly resale median moved +14.1%. It went from $1,714 psf in 4Q2024 (3 sales) to $1,955 psf in 3Q2026 (9 sales). All figures here are indicative and drawn from recorded transactions, not formal valuations of any home.
The quarterly median has moved +14.1%, but the first quarters rest on very few sales
We start with the counts, because they shape how far you can trust each quarter. 4Q2024 had 3 sales and 1Q2025 had 7. Those two medians rest on very few deals, so we would not lean on them. The busiest quarter was 2Q2026, with 19 sales. 3Q2025 was next at 18. The latest quarter has 9 sales, which is fewer than most of the quarters before it.
From 1Q2025 to 4Q2025 the median stayed between $1,914 psf and $1,929 psf. It dipped to $1,844 psf in 1Q2026 on 10 sales. It came back to $1,924 psf in 2Q2026 and reached $1,955 psf in 3Q2026. The 25th and 75th percentile columns in 3Q2026 run from $1,937 psf to $1,973 psf, a narrow spread, though from a small count. The +14.1% leans on a 3-sale starting point. It points to a higher level now than at the start of the period. It does not show a steady climb. The table and chart below carry the same quarterly series.
| Quarter | Resales | Median psf | 25th percentile | 75th percentile |
|---|---|---|---|---|
| Q4 2024 | 3 | S$1,714 psf | S$1,683 psf | S$1,813 psf |
| Q1 2025 | 7 | S$1,922 psf | S$1,898 psf | S$2,005 psf |
| Q2 2025 | 10 | S$1,929 psf | S$1,855 psf | S$1,986 psf |
| Q3 2025 | 18 | S$1,914 psf | S$1,818 psf | S$1,991 psf |
| Q4 2025 | 15 | S$1,919 psf | S$1,901 psf | S$1,994 psf |
| Q1 2026 | 10 | S$1,844 psf | S$1,812 psf | S$1,886 psf |
| Q2 2026 | 19 | S$1,924 psf | S$1,846 psf | S$2,000 psf |
| Q3 2026 | 9 | S$1,955 psf | S$1,937 psf | S$1,973 psf |
Units of 50 to 69 sqm were the most traded size, and the smallest units priced lowest per sqft
The table below splits the four quarters from 4Q2025 to 3Q2026 by unit size. Units of 50 to 69 sqm were the most traded, with 21 resales at a median of $1,350,000 ($1,944 psf). Their median area was 689 sqft. The under 50 sqm band had 12 resales at a median of $876,944, or $1,810 psf. That is the lowest psf of the four bands.
The two larger bands sit close together. Units of 70 to 89 sqm had a median of $1,550,000 ($1,954 psf), the highest psf in the table. Units of 90 to 119 sqm had a median of $1,915,000 ($1,934 psf) from 11 resales. Each band holds a modest number of sales, and the 70 to 89 sqm band has only 9. The data does not settle why the smallest units price lower per sqft. It only shows that they do over this window.
| Size band | Resales | Median area | Median price | Median psf |
|---|---|---|---|---|
| under 50 sqm | 12 | 484 sqft | S$876,944 | S$1,810 psf |
| 50 to 69 sqm | 21 | 689 sqft | S$1,350,000 | S$1,944 psf |
| 70 to 89 sqm | 9 | 786 sqft | S$1,550,000 | S$1,954 psf |
| 90 to 119 sqm | 11 | 990 sqft | S$1,915,000 | S$1,934 psf |
Rents were steady per sqft, while the monthly figure moved around from quarter to quarter
Rental figures come from URA rental contracts. In 3Q2026 there were 64 contracts at a median of $6.38 psf a month, with a median rent of $3,300. Against the resale median, this site's engine puts the gross yield at about 3.8%. That is a measured ratio of recorded rents to recorded resale prices, not a quote for any single unit.
The per-sqft rent and the monthly rent do not move together in the table below. Per sqft, the median went from 6.0 in 4Q2025 and 1Q2026 to 5.8 in 2Q2026, then to 6.4 in 3Q2026. The monthly median was $3,600 in 4Q2025, $3,250 in 1Q2026, $3,600 in 2Q2026 and $3,300 in 3Q2026. The table does not show the unit sizes behind each quarter's contracts. A different mix of sizes would produce this pattern, but we cannot confirm that from these figures. 1Q2026 had the most contracts, at 84.
| Quarter | Contracts | Median rent (S$ psf a month) | Median monthly rent |
|---|---|---|---|
| Q4 2025 | 51 | 6.0 | S$3,600 |
| Q1 2026 | 84 | 6.0 | S$3,250 |
| Q2 2026 | 73 | 5.8 | S$3,600 |
| Q3 2026 | 64 | 6.4 | S$3,300 |
Midwood's median sits +29.1% above its district and above every project within 1 km
Over the same four quarters, the District 23 resale median was $1,486 psf from 823 sales. Midwood's $1,919 psf sits +29.1% against it. That puts it ahead of the district figure by a clear margin, with a sample of 53 sales on the Midwood side.
The table below lists the eight projects with the most resales within 1 km. The two closest, Kingsford . Hillview Peak at 94 m and The Hillier at 130 m, are also 99-year leaseholds. They had 27 and 22 resales, at $1,457 psf and $1,538 psf. The freehold Symphony Heights had the highest median in the list, $1,858 psf from 11 resales. The 999-year leaseholds range from $1,507 psf at Merawoods to $1,770 psf at Hazel Park Condominium. Tenure differs across these projects. The table does not show the age or size mix of the units sold, so it cannot say what drives the gaps.
| Project | Tenure | TOP | Distance | Resales | Median psf |
|---|---|---|---|---|---|
| Kingsford . Hillview Peak | 99-year leasehold | — | 94 m | 27 | S$1,457 psf |
| The Hillier | 99-year leasehold | — | 130 m | 22 | S$1,538 psf |
| The Skywoods | 99-year leasehold | — | 879 m | 19 | S$1,708 psf |
| The Lanai | 999-year leasehold | — | 887 m | 16 | S$1,685 psf |
| Hillington Green | 999-year leasehold | — | 429 m | 14 | S$1,680 psf |
| Hazel Park Condominium | 999-year leasehold | — | 928 m | 12 | S$1,770 psf |
| Symphony Heights | freehold | — | 902 m | 11 | S$1,858 psf |
| Merawoods | 999-year leasehold | — | 971 m | 10 | S$1,507 psf |
All five of the highest resale prices came in 2Q2026 and 3Q2026, led by $2,568,000
The top price in the window was $2,568,000 in 2Q2026. It was for a 1,249 sqft unit on the 21-25 storey range, at $2,057 psf. The next two were $2,560,000 for 1,259 sqft on the 26-30 range ($2,033 psf) and $2,520,000 for 1,249 sqft on the 16-20 range ($2,018 psf). Both of those came in 3Q2026.
The other two entries are 990 sqft units on the 01-05 range. One sold for $1,950,000 in 2Q2026 ($1,969 psf) and one for $1,935,888 in 3Q2026 ($1,955 psf). So the table below includes both large units and the lower-floor 990 sqft units. It shows five transactions only. It says nothing about how often prices at this level occur. Every row falls in the latest two quarters, but the table is a ranking of single sales, not a trend.
| Quarter | Storey range | Area | Price | Per sqft |
|---|---|---|---|---|
| Q2 2026 | 21-25 | 1,249 sqft | S$2,568,000 | S$2,057 psf |
| Q3 2026 | 26-30 | 1,259 sqft | S$2,560,000 | S$2,033 psf |
| Q3 2026 | 16-20 | 1,249 sqft | S$2,520,000 | S$2,018 psf |
| Q2 2026 | 01-05 | 990 sqft | S$1,950,000 | S$1,969 psf |
| Q3 2026 | 01-05 | 990 sqft | S$1,935,888 | S$1,955 psf |
Tested against 38 later sales, our estimate missed by a median of 1.9%
We also checked how this site's estimate has done at Midwood. As of 1Q2026, we tested it against 38 later sales at the project. The median error was 1.9%. 63% of those sales fell inside the stated range, and the rest fell outside it.
That is a record of past performance on one project, and the test sample is modest. The estimate remains indicative. It is built from recorded transactions and is never a formal valuation of a home. Any single unit can sell above or below it, depending on floor, view, condition and the other details a transaction record does not carry.
Several things stay open. The latest quarter's median rests on a small count, and the earliest quarters did too. We will watch whether the next quarter's sales count rises and whether the median holds near its recent band. We will also check whether the per-sqft rent stays where it is, and whether sales above $2.5M appear again. The unit mix behind both resales and rents is the main thing these tables cannot show.
One headline figure is rarely enough on its own. A median, a yield or a single top price only means something next to the others. The value lies in how Midwood's numbers fit together, and in how they sit against the district and the neighbouring projects. We will keep reading them that way as each new quarter comes in.
Method: URA resale caveats at the project (developer sales and sub-sales excluded) by the quarter of the sale month. Size bands by caveated floor area. Rents are URA rental contracts at the project, and the gross yield is the mean of the quarterly median rents per square foot, annualised, over the four-quarter resale median per square foot, before any cost. Lease left is the tenure less the years since the lease started, as recorded. The estimate accuracy is this site's backtest: the engine run as of the quarter named, compared with the sales since. Private figures are from URA Data Service caveats, HDB figures from data.gov.sg resale records, both loaded weekly by this site's ingest. Medians are of the non-excluded transactions in the period named. Sales flagged by the hygiene rules (related-party transfers, bulk deals, outliers) are left out. Every figure is indicative and drawn from recorded transactions, not a formal valuation. Facilities, layouts and photographs, where shown, are as supplied by the developer or seen on our own visit, and are not engine data.