Avenue South Residence By The Numbers: 56 Resales And A Median Of S$2,275 psf In Q2 2026
Published 30 Sept 2026 · Avenue South Residence
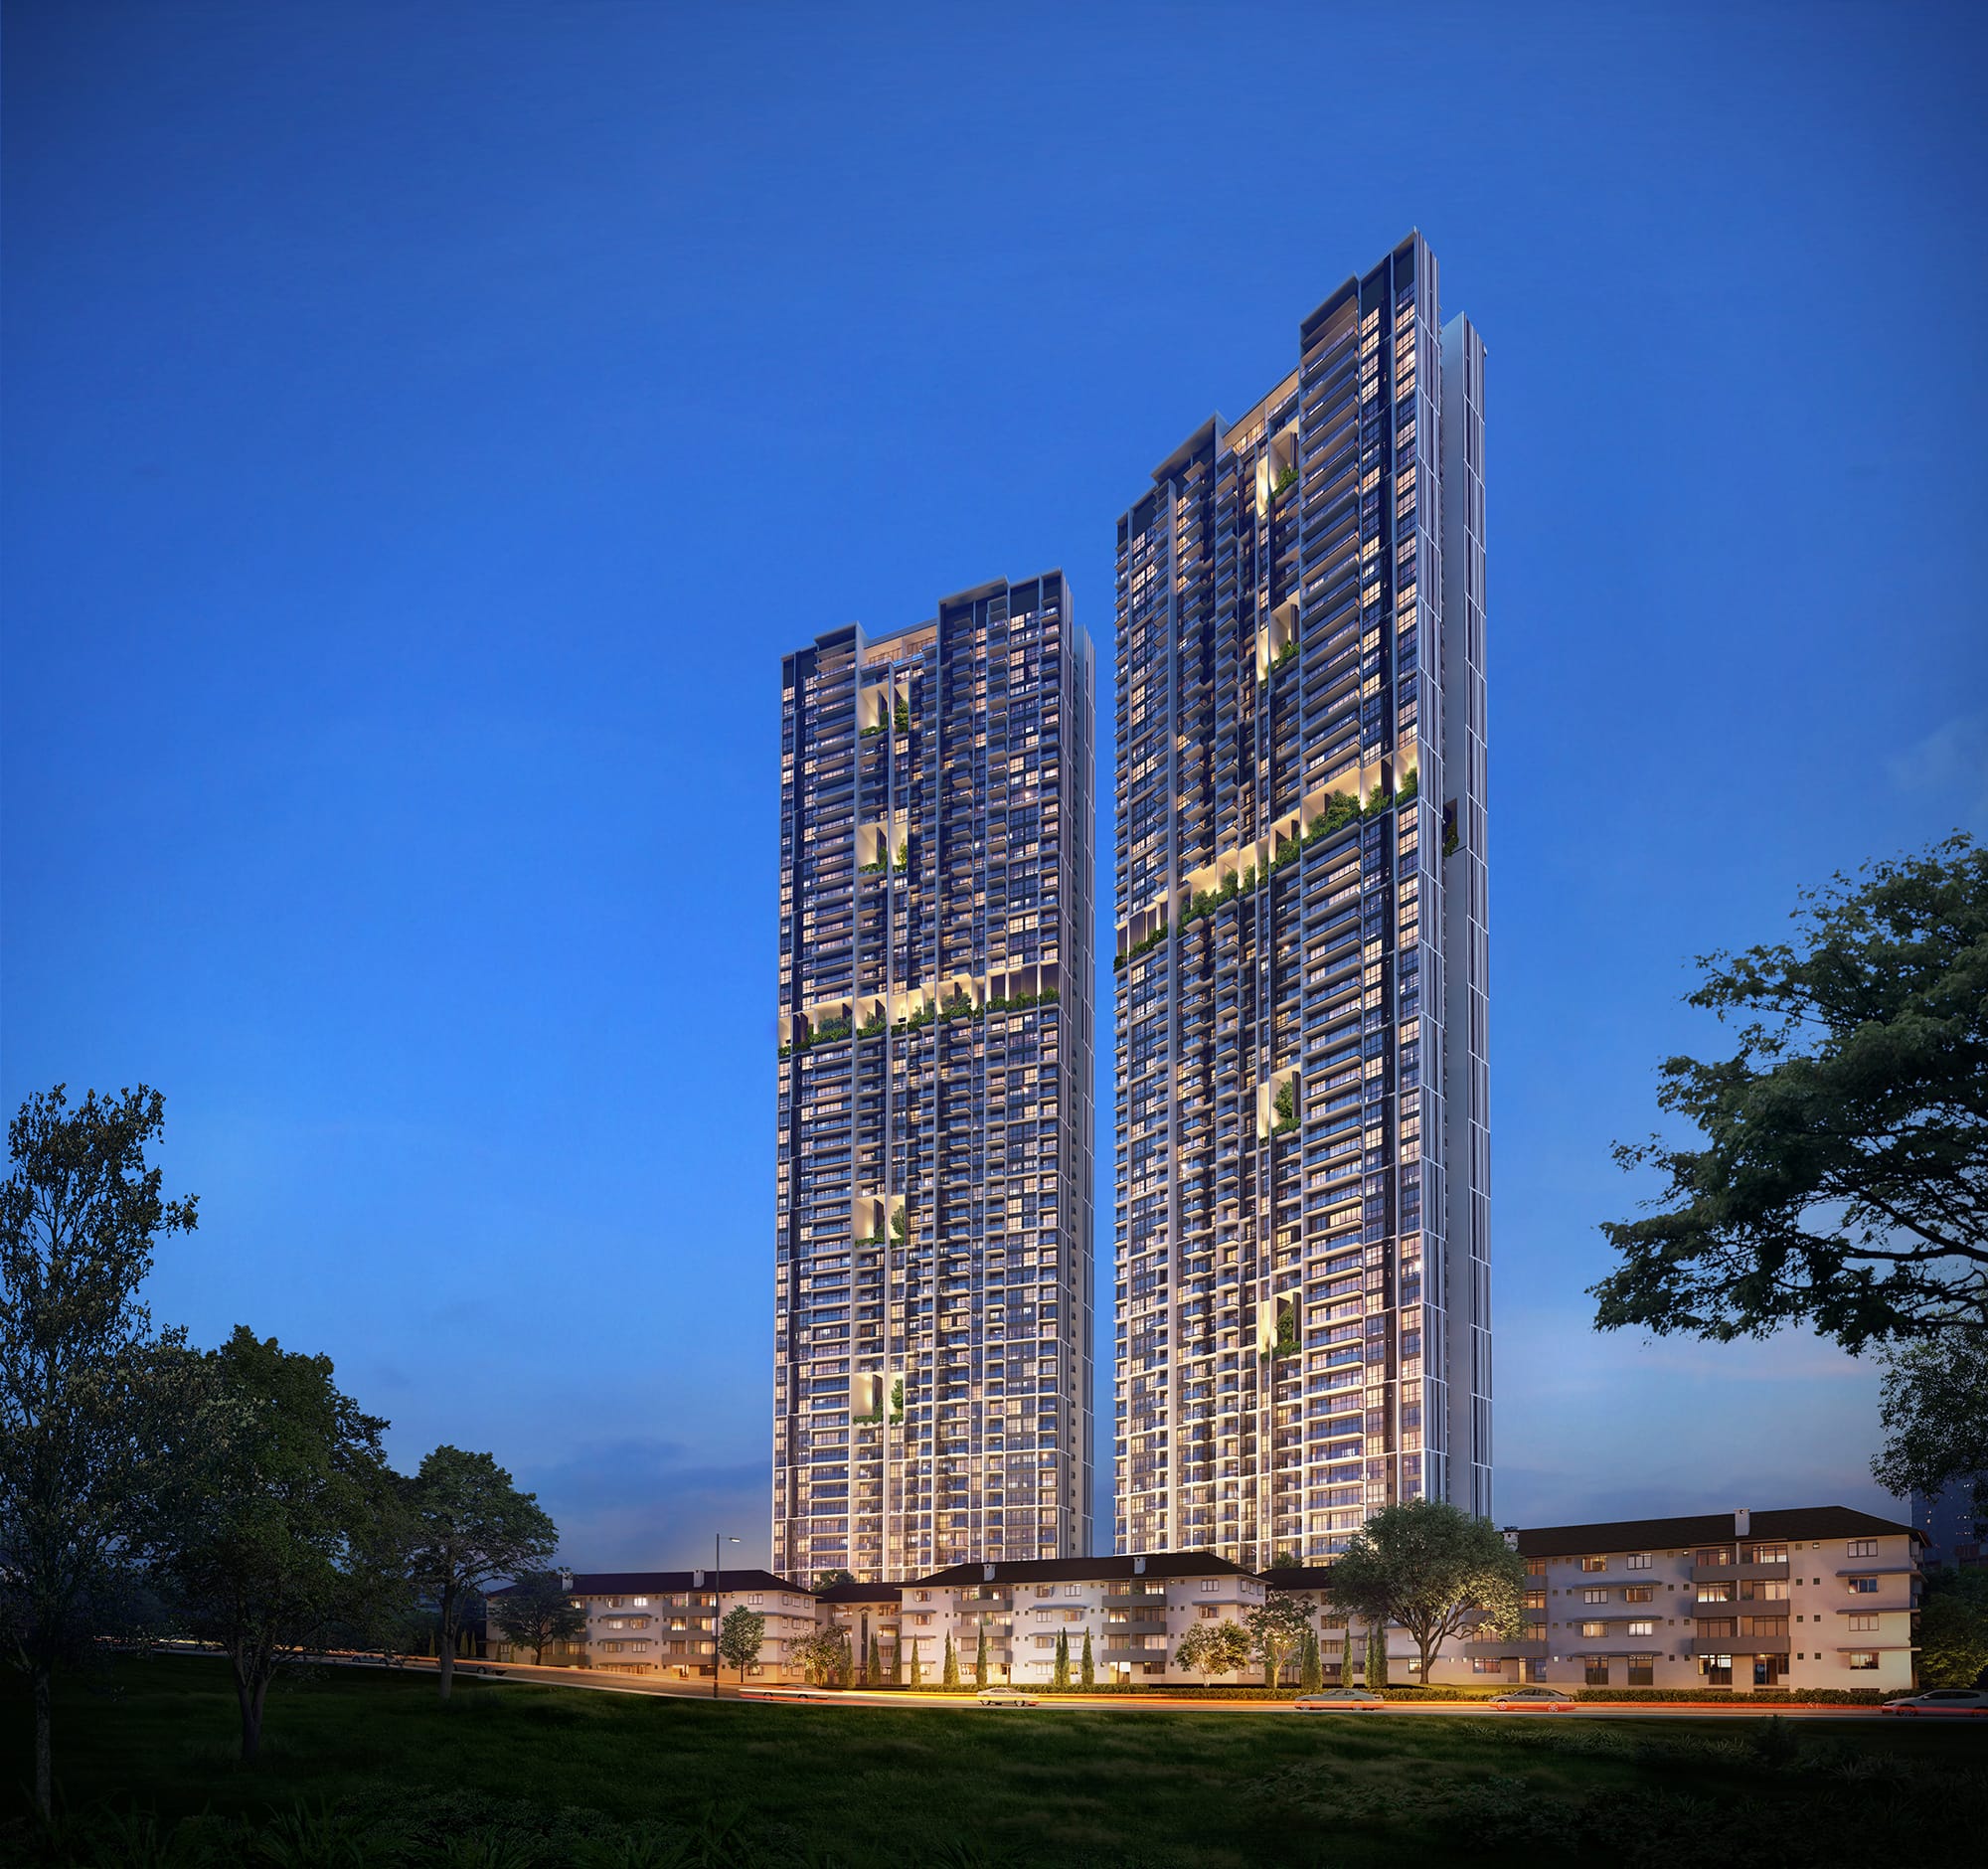
If you own, rent or watch a unit at Avenue South Residence, the numbers move every quarter. Resale prices, rents and the mix of sizes all shift together.
In this article, we look at eight quarters of resales at the project, the prices by unit size, the rental contracts, the nearby projects within 1 km, and how our own estimate has performed there.
Avenue South Residence is a 99 apartment project in District 3, with 91 years of lease left. It recorded 56 resales over Q3 2025 to Q2 2026 at a median of S$2,275 psf, based on URA Data Service caveats.
How Have Resale Prices Moved Since Q3 2024?
Quarterly medians at a single project can swing with the mix of units sold. The table and chart below show both the median psf and the number of resales behind it.
Across the 8 quarters shown, the quarterly median moved -3.0%. It went from S$2,281 psf in Q3 2024, on 8 sales, to S$2,213 psf in Q2 2026, on 14 sales.
Note the spread within each quarter. In Q4 2025 the 25th percentile was S$2,111 psf and the 75th was S$2,439 psf. The quarter with the most sales was Q3 2025, with 19.
| Quarter | Resales | Median psf | 25th percentile | 75th percentile |
|---|---|---|---|---|
| Q3 2024 | 8 | S$2,281 psf | S$2,140 psf | S$2,331 psf |
| Q4 2024 | 12 | S$2,274 psf | S$2,157 psf | S$2,306 psf |
| Q1 2025 | 12 | S$2,161 psf | S$2,000 psf | S$2,470 psf |
| Q2 2025 | 16 | S$2,278 psf | S$2,143 psf | S$2,402 psf |
| Q3 2025 | 19 | S$2,299 psf | S$2,134 psf | S$2,443 psf |
| Q4 2025 | 12 | S$2,313 psf | S$2,111 psf | S$2,439 psf |
| Q1 2026 | 11 | S$2,180 psf | S$2,136 psf | S$2,342 psf |
| Q2 2026 | 14 | S$2,213 psf | S$2,091 psf | S$2,313 psf |
Which Unit Sizes Traded Most?
Size drives both the price tag and the psf. The table below breaks the 56 resales over Q3 2025 to Q2 2026 into bands.
Units of 50 to 69 sqm were the most traded size. There were 31 resales at a median of S$1,530,000, or S$2,258 psf, on a median area of 689 sqft.
The smallest band sold at the lowest psf. Units under 50 sqm had 8 resales at a median of S$1,050,250, or S$2,098 psf. The 90 to 119 sqm band had the highest median psf at S$2,390, but on only 6 sales.
| Size band | Resales | Median area | Median price | Median psf |
|---|---|---|---|---|
| under 50 sqm | 8 | 527 sqft | S$1,050,250 | S$2,098 psf |
| 50 to 69 sqm | 31 | 689 sqft | S$1,530,000 | S$2,258 psf |
| 70 to 89 sqm | 7 | 947 sqft | S$2,178,000 | S$2,299 psf |
| 90 to 119 sqm | 6 | 1,109 sqft | S$2,650,000 | S$2,390 psf |
| 120 sqm and above | 4 | 1,496 sqft | S$3,487,500 | S$2,331 psf |
The Largest Deals At Avenue South Residence
A handful of big-ticket sales sit well above the project median. The table below lists the top five by price over the same four quarters.
The highest resale price in the window was S$3,785,000 in Q3 2025. That was a 1,496 sqft unit in the 51-55 storey range, at S$2,530 psf.
Storey height shows up in the psf. A 1,109 sqft unit in the 41-45 range fetched S$2,553 psf in Q1 2026, the highest psf on this list.
| Quarter | Storey range | Area | Price | Per sqft |
|---|---|---|---|---|
| Q3 2025 | 51-55 | 1,496 sqft | S$3,785,000 | S$2,530 psf |
| Q1 2026 | 41-45 | 1,496 sqft | S$3,500,000 | S$2,339 psf |
| Q3 2025 | 26-30 | 1,496 sqft | S$3,475,000 | S$2,323 psf |
| Q2 2026 | 56-60 | 1,302 sqft | S$3,010,000 | S$2,311 psf |
| Q1 2026 | 41-45 | 1,109 sqft | S$2,830,000 | S$2,553 psf |
What Do The Rental Numbers Show?
Rental approvals are recorded separately from sales. The table below shows the last four quarters of contracts at the project.
Q2 2026 saw 75 contracts at a median of S$6.46 psf a month, with a median monthly rent of S$4,100. Against the resale median, our engine puts the gross yield at about 3.4%.
Contract counts fell across the four quarters, from 117 in Q3 2025 to 75 in Q2 2026. Median rent stayed close to S$4,100, with S$4,200 recorded in Q1 2026.
| Quarter | Contracts | Median rent (S$ psf a month) | Median monthly rent |
|---|---|---|---|
| Q3 2025 | 117 | 6.5 | S$4,100 |
| Q4 2025 | 87 | 6.5 | S$4,100 |
| Q1 2026 | 86 | 6.4 | S$4,200 |
| Q2 2026 | 75 | 6.5 | S$4,100 |
How Does It Compare With The District And Neighbours?
Over the same four quarters, District 3 recorded a resale median of S$2,216 psf from 614 sales. Avenue South Residence sits +2.7% against that.
The table below lists resales within 1 km of the project, by project.
Highline Residences had the most sales among the neighbours, with 17 at a median of S$2,501 psf. Sky Everton recorded S$2,875 psf on 7 sales, while Central Green Condominium came in at S$1,756 psf on 12. Tenure and unit mix differ across these projects, and some counts are small.
| Project | Tenure | TOP | Distance | Resales | Median psf |
|---|---|---|---|---|---|
| Highline Residences | 99-year leasehold | — | 808 m | 17 | S$2,501 psf |
| Spottiswoode Residences | freehold | — | 809 m | 13 | S$2,266 psf |
| Central Green Condominium | 99-year leasehold | — | 884 m | 12 | S$1,756 psf |
| Spottiswoode 18 | freehold | — | 883 m | 8 | S$2,376 psf |
| Sky Everton | freehold | — | 944 m | 7 | S$2,875 psf |
| The Pearl @ Mount Faber | 99-year leasehold | — | 901 m | 6 | S$1,556 psf |
| Spottiswoode Suites | freehold | — | 871 m | 5 | S$2,331 psf |
| Blair Plain Conservation Area | freehold | — | 686 m | 4 | S$3,356 psf |
How Accurate Has Our Estimate Been Here?
Our engine publishes an indicative estimate for each project. We test it against sales that happened after the estimate was made.
As of Q4 2025, we tested 45 later sales at Avenue South Residence. The median error was 7.7%, and 47% of those sales landed inside the stated range.
These are indicative figures drawn from recorded transactions. They are not a formal valuation of any single unit.
Summary
Avenue South Residence recorded 56 resales over Q3 2025 to Q2 2026 at a median of S$2,275 psf. The quarterly median moved -3.0% across the eight quarters shown, ending at S$2,213 psf in Q2 2026. Units of 50 to 69 sqm dominated, with 31 resales at a median of S$1,530,000. On the rental side, Q2 2026 brought 75 contracts at a median rent of S$4,100, for a gross yield of about 3.4%.
The data comes from URA Data Service caveats and rental contracts, plus our own engine for the yield and backtest. It shows what was transacted and when. It cannot tell you the condition, view or facing of any one unit, and quarterly medians at a single project rest on small counts.
In pictures
Method: URA resale caveats at the project (developer sales and sub-sales excluded) by the quarter of the sale month. Size bands by caveated floor area. Rents are URA rental contracts at the project, and the gross yield is the mean of the quarterly median rents per square foot, annualised, over the four-quarter resale median per square foot, before any cost. Lease left is the tenure less the years since the lease started, as recorded. The estimate accuracy is this site's backtest: the engine run as of the quarter named, compared with the sales since. Private figures are from URA Data Service caveats, HDB figures from data.gov.sg resale records, both loaded weekly by this site's ingest. Medians are of the non-excluded transactions in the period named. Sales flagged by the hygiene rules (related-party transfers, bulk deals, outliers) are left out. Every figure is indicative and drawn from recorded transactions, not a formal valuation.