What S$1,300,000 Bought In District 23 In 2Q2026 — 78 Resales, And The Largest Was A 2,810 sqft Landed Home At S$285 psf
Published 2 Nov 2026
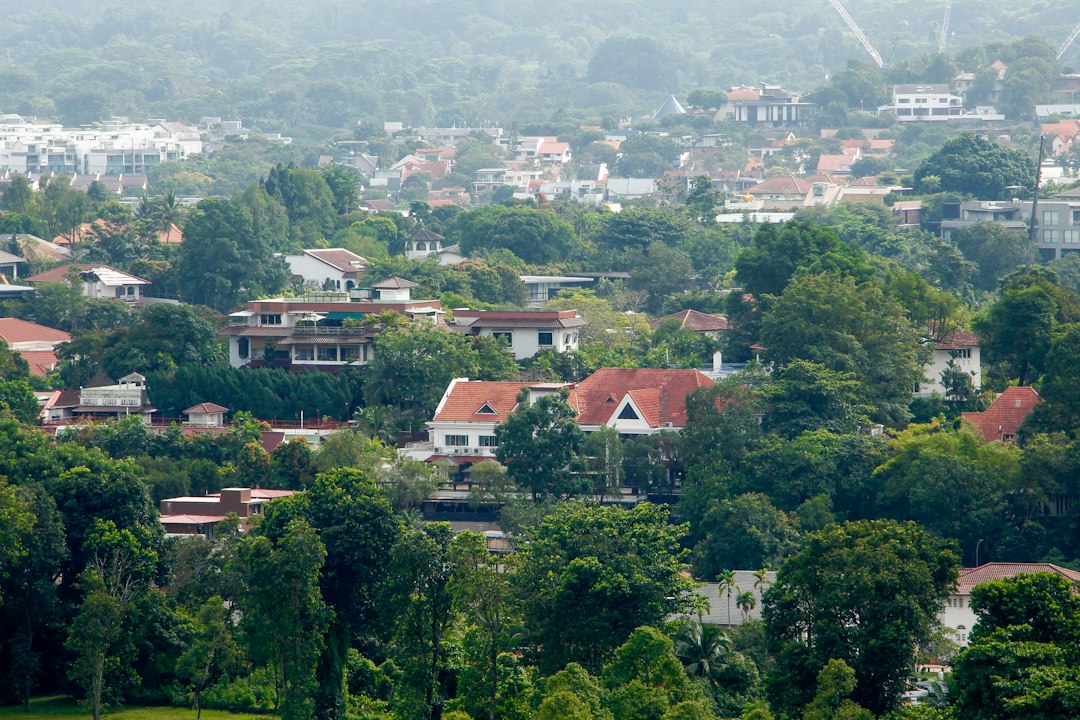
District 23 covers Bukit Panjang, Hillview and Choa Chu Kang. It is one of those districts where a budget under S$1.3M still buys floor area, not just a foothold. We wanted to see exactly what that budget bought last quarter, so we went to the caveats.
According to URA Data Service caveats, 78 of the district's 218 private resales in 2Q2026 were at or under S$1,300,000. That is 35.8% of the quarter's deals, spread across 27 projects. Their median worked out to S$1,411 psf, against S$1,506 psf for the district as a whole, or -6.3%. The district's median resale price for the quarter was S$1,435,900. The S$1,300,000 budget sits at the 40th percentile of the quarter's prices, rounded down to the nearest S$100,000. This is a record of what sold, not a list of what is on the market.
More than a third of the quarter's resales cleared at or under S$1,300,000
The first number worth sitting with is the share. 78 out of 218 is 35.8%. In a district where the median resale price was S$1,435,900, a budget below that median still reached a large slice of the quarter's recorded deals.
The spread matters too. Those 78 caveats came from 27 projects. So this was not one large estate clearing stock at a single price point. It was activity across many addresses.
The median under the budget was S$1,411 psf. The district median was S$1,506 psf. The gap is -6.3%. That is a mix effect as much as anything. Larger and older leasehold stock tends to sit at lower psf. The caveats do not tell us about condition, renovation or facing. They record price, area, storey band and month.
The largest unit under the budget was a 2,810 sqft landed home at Fuyong Estate
The size ranking opens with something unusual. A 2,810 sqft landed home at Fuyong Estate sold for S$800,000 in Jun 2026, on a 99-year leasehold. That works out to S$285 psf in the table. It is the only landed entry in the top ten by size.
Everything else in that list is strata. Palm Gardens appears twice at 1,216 sqft, at S$1,260,000 (S$1,036 psf) on the 06-10 band and S$1,295,000 (S$1,065 psf) on the 11-15 band. Regent Grove takes five of the ten rows, at 1,173 sqft and 1,163 sqft. Regent Heights and Parkview Apartments close out the list.
One caveat on the caveats. A single landed transaction at this price is one data point. It does not describe the Fuyong Estate market, and the records carry no detail on the state of the house. The table below ranks by area alone.
| Project | Type | Tenure | TOP | Area | Storey range | Price | Per sqft | Month |
|---|---|---|---|---|---|---|---|---|
| Fuyong Estate | landed | 99-year leasehold | — | 2,810 sqft | - | S$800,000 | S$285 psf | Jun 2026 |
| Palm Gardens | condo | 99-year leasehold | — | 1,216 sqft | 06-10 | S$1,260,000 | S$1,036 psf | Jun 2026 |
| Palm Gardens | condo | 99-year leasehold | — | 1,216 sqft | 11-15 | S$1,295,000 | S$1,065 psf | Jun 2026 |
| Regent Grove | condo | 99-year leasehold | — | 1,173 sqft | 06-10 | S$1,075,000 | S$916 psf | May 2026 |
| Regent Grove | condo | 99-year leasehold | — | 1,163 sqft | 01-05 | S$1,165,000 | S$1,002 psf | May 2026 |
| Regent Grove | condo | 99-year leasehold | — | 1,163 sqft | 11-15 | S$1,200,000 | S$1,032 psf | May 2026 |
| Regent Grove | condo | 99-year leasehold | — | 1,163 sqft | 11-15 | S$1,208,000 | S$1,039 psf | Apr 2026 |
| Regent Grove | condo | 99-year leasehold | — | 1,163 sqft | 11-15 | S$1,230,000 | S$1,058 psf | May 2026 |
| Regent Heights | condo | 99-year leasehold | — | 1,163 sqft | 01-05 | S$1,250,000 | S$1,075 psf | Jun 2026 |
| Parkview Apartments | apartment | 99-year leasehold | — | 1,130 sqft | 06-10 | S$1,060,000 | S$938 psf | Apr 2026 |
The psf ranking is led by the same Fuyong Estate sale, then a tight cluster near S$1,000 psf
The lowest psf under the budget is the Fuyong Estate deal again, at S$285 psf. After that, the numbers jump sharply. The next entry is Regent Grove at S$916 psf, for 1,173 sqft at S$1,075,000 in May 2026.
From there the list tightens. Parkview Apartments holds six of the ten rows. Its entries run from S$938 psf for 1,130 sqft at S$1,060,000, up to S$1,021 psf for 1,087 sqft at S$1,110,000. Two 980 sqft units on the 11-15 band sold in Jun 2026, at S$985,000 (S$1,006 psf) and S$990,000 (S$1,011 psf).
That clustering points to a narrow band of pricing within one project. The storey bands in the table range from 01-05 to 11-15, and the psf figures do not sort neatly by height. The table below ranks by psf alone.
| Project | Type | Tenure | TOP | Area | Storey range | Price | Per sqft | Month |
|---|---|---|---|---|---|---|---|---|
| Fuyong Estate | landed | 99-year leasehold | — | 2,810 sqft | - | S$800,000 | S$285 psf | Jun 2026 |
| Regent Grove | condo | 99-year leasehold | — | 1,173 sqft | 06-10 | S$1,075,000 | S$916 psf | May 2026 |
| Parkview Apartments | apartment | 99-year leasehold | — | 1,130 sqft | 06-10 | S$1,060,000 | S$938 psf | Apr 2026 |
| Parkview Apartments | apartment | 99-year leasehold | — | 1,119 sqft | 01-05 | S$1,100,000 | S$983 psf | May 2026 |
| Parkview Apartments | apartment | 99-year leasehold | — | 1,119 sqft | 06-10 | S$1,115,000 | S$996 psf | Jun 2026 |
| Regent Grove | condo | 99-year leasehold | — | 1,163 sqft | 01-05 | S$1,165,000 | S$1,002 psf | May 2026 |
| Parkview Apartments | apartment | 99-year leasehold | — | 980 sqft | 11-15 | S$985,000 | S$1,006 psf | Jun 2026 |
| Parkview Apartments | apartment | 99-year leasehold | — | 980 sqft | 11-15 | S$990,000 | S$1,011 psf | Jun 2026 |
| Parkview Apartments | apartment | 99-year leasehold | — | 1,087 sqft | 01-05 | S$1,110,000 | S$1,021 psf | May 2026 |
| Regent Heights | condo | 99-year leasehold | — | 1,023 sqft | 11-15 | S$1,050,000 | S$1,027 psf | Apr 2026 |
Four projects account for every row in both tables
Across the two rankings, the same names keep coming back. Fuyong Estate, Palm Gardens, Regent Grove, Regent Heights and Parkview Apartments. All are on 99-year leasehold, and the TOP year is not recorded in these caveats.
That concentration is a feature of how the tables are built. They show the top ten by size and the top ten by psf. The wider pool was 78 caveats across 27 projects. Most of those projects do not appear here at all.
So read the tables as the edges of the distribution, not its centre. The centre is the median: S$1,411 psf for units at or under the budget. The caveats say nothing about asking prices or unsold stock. They record what changed hands.
What the figures leave open is whether this share holds. 35.8% of 2Q2026 resales landing at or under S$1,300,000 is one quarter's reading. The next set of caveats will show whether the under-budget pool stays this wide, and whether the 27-project spread narrows. The psf gap of -6.3% against the district median is also worth tracking, since it moves with mix as much as with price.
A single quarter of caveats is a snapshot, and a partial one. It tells you what sold and at what recorded price, not what was listed or what was withdrawn. The value sits in repetition. Watch the same district over several quarters, and the shape of what a given budget reaches becomes clearer than any one headline figure can make it.
Method: resale caveats (developer sales and sub-sales excluded) in the district and quarter named with a price at or under the budget, single-unit caveats only. Ranked by caveated floor area and by price per square foot. These are recorded sales, not listings, and say nothing about what is available or what a unit would fetch now. Private figures are from URA Data Service caveats, HDB figures from data.gov.sg resale records, both loaded weekly by this site's ingest. Medians are of the non-excluded transactions in the period named. Sales flagged by the hygiene rules (related-party transfers, bulk deals, outliers) are left out. Every figure is indicative and drawn from recorded transactions, not a formal valuation.