The Tampines Trilliant Is Up 15.6% Over Eight Quarters — But Its Biggest Sale Printed At S$1,420 psf
Published 10 Oct 2026 · The Tampines Trilliant
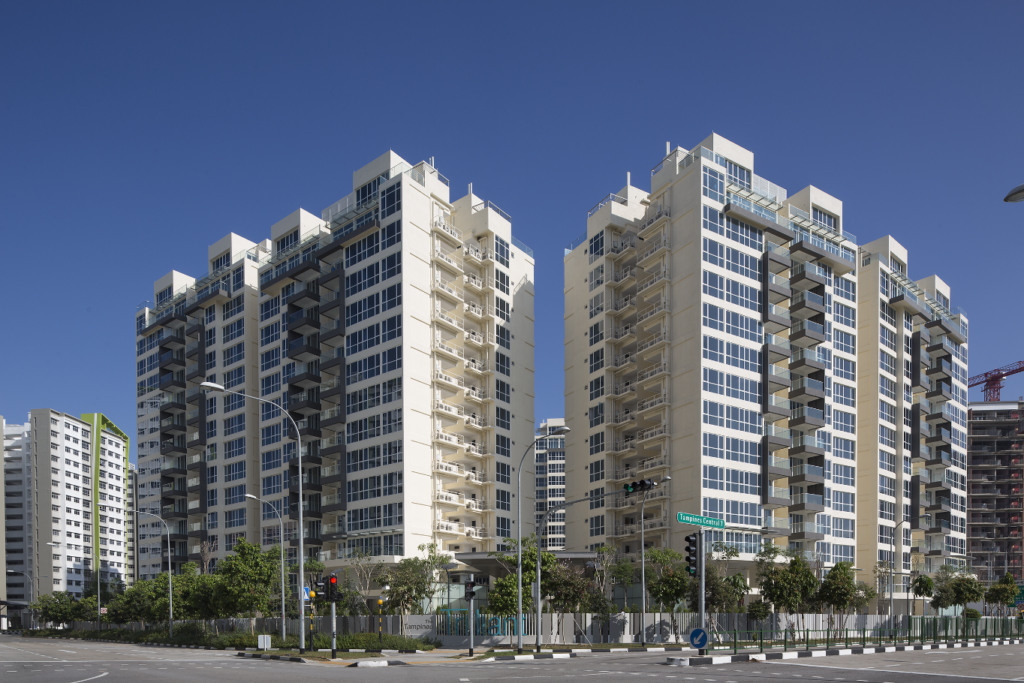
A median can rise for eight quarters in a row and still leave plenty unsaid. The Tampines Trilliant is a good example. The line on the chart only goes one way. The largest cheques in the same window sit at the bottom of the per-square-foot range.
According to URA Data Service caveats, this 99-year EC in District 18 recorded 49 resales over 3Q2025 to 2Q2026, at a median of S$1,741 psf. The lease started in 2011, and there are 84 years left on it. Over the eight quarters shown, the quarterly resale median moved +15.6%, from S$1,512 psf in 3Q2024 to S$1,748 psf in 2Q2026. We also pulled the rental contracts, the neighbouring projects within 1 km, and the backtest of our own estimate here. Here is what stood out to us when we sat with the tables.
The quarterly median has not fallen once across the eight quarters shown
The series is unusually tidy. Every quarter in the table prints a median at or above the one before it. It starts at S$1,512 psf in 3Q2024, on 14 sales. It ends at S$1,748 psf in 2Q2026, on 16 sales. The biggest single step comes early, between 3Q2024 and 4Q2024, when the median moves to S$1,611 psf. After that the gains get smaller. From 1Q2025 to 2Q2025 the median barely moves, S$1,688 psf to S$1,689 psf. The last two quarters are close too, S$1,744 psf then S$1,748 psf. So the direction is consistent, but the pace is not.
There is a caveat worth holding on to. Quarterly counts here are small, from 9 sales up to 16. With that few caveats, one large or one low-floor unit shifts the median. Mix matters as well. A quarter weighted towards smaller units will read higher per square foot, with no change in the asking behaviour of owners. The spread columns show this. In 4Q2025 the lower quartile sits at S$1,465 psf while the upper sits at S$1,757 psf. That is a wide gap for 13 sales. In 1Q2026 the same columns sit close together, S$1,724 psf and S$1,764 psf.
| Quarter | Resales | Median psf | 25th percentile | 75th percentile |
|---|---|---|---|---|
| Q3 2024 | 14 | S$1,512 psf | S$1,496 psf | S$1,531 psf |
| Q4 2024 | 10 | S$1,611 psf | S$1,573 psf | S$1,651 psf |
| Q1 2025 | 9 | S$1,688 psf | S$1,656 psf | S$1,700 psf |
| Q2 2025 | 15 | S$1,689 psf | S$1,648 psf | S$1,733 psf |
| Q3 2025 | 10 | S$1,699 psf | S$1,685 psf | S$1,757 psf |
| Q4 2025 | 13 | S$1,725 psf | S$1,465 psf | S$1,757 psf |
| Q1 2026 | 10 | S$1,744 psf | S$1,724 psf | S$1,764 psf |
| Q2 2026 | 16 | S$1,748 psf | S$1,727 psf | S$1,808 psf |
The most traded size band is not the one with the highest psf
Split the same 49 resales by size and the order inverts. The 90 to 119 sqm band does most of the volume, 31 resales at a median of S$1,878,000, or S$1,740 psf, on a median area of 1,130 sqft. The smallest band, 70 to 89 sqm, has only 6 resales, but the highest per-square-foot median at S$1,835 psf. Its median price is S$1,600,000 on 872 sqft. The largest band, 120 sqm and above, has 12 resales at a median of S$2,302,500, and the lowest psf median at S$1,725 psf.
That pattern is common enough, and the table shows it plainly rather than explaining it. What the figures cannot settle is floor level. The band breakdown does not carry storey, so a cheaper psf in the big-unit band may reflect height as much as size. Six sales in the smallest band is also thin. We would not read the S$1,835 psf median as a fixed level for that layout. It is the middle of six recorded transactions over four quarters, nothing more.
| Size band | Resales | Median area | Median price | Median psf |
|---|---|---|---|---|
| 70 to 89 sqm | 6 | 872 sqft | S$1,600,000 | S$1,835 psf |
| 90 to 119 sqm | 31 | 1,130 sqft | S$1,878,000 | S$1,740 psf |
| 120 sqm and above | 12 | 1,302 sqft | S$2,302,500 | S$1,725 psf |
Rents have held inside a narrow band for four straight quarters
The rental side is flatter than the resale side. Across the four quarters of contracts, the median sits at S$4.2 psf a month in three of them and S$4.3 psf a month in 1Q2026. Contract counts move more than the rate does. There were 15 contracts in 3Q2025, 24 in 4Q2025, 22 in 1Q2026 and 17 in 2Q2026. Median monthly rent ranges from S$4,275 in 1Q2026 to S$4,500 in 3Q2025. The most recent quarter reads S$4,400.
Put the 2Q2026 rental median against the resale median and our engine measures a gross yield of about 2.9%. That is a measured figure, not a return anyone banked. It takes recorded rents over recorded resale prices, before any outgoings. It also mixes two populations. The units being let are not necessarily the units being sold. Rental approvals come from the same public records as the caveats, so both sides are backward-looking by design.
| Quarter | Contracts | Median rent (S$ psf a month) | Median monthly rent |
|---|---|---|---|
| Q3 2025 | 15 | 4.2 | S$4,500 |
| Q4 2025 | 24 | 4.2 | S$4,300 |
| Q1 2026 | 22 | 4.3 | S$4,275 |
| Q2 2026 | 17 | 4.2 | S$4,400 |
The project sits about 20% above the wider District 18 resale median
Over the same four quarters, District 18 recorded 1,023 resales at a median of S$1,453 psf. The Tampines Trilliant sits +19.9% against that. The district figure covers every private resale caught in the district, across tenures, ages and segments, so it is a backdrop rather than a like-for-like comparison.
The 1 km table is narrower and more useful. Citylife@Tampines, another 99-year leasehold, is 161 m away and recorded 24 resales at a median of S$1,662 psf. Pinevale, also 99-year leasehold, is 747 m away and recorded 3 resales at a median of S$1,167 psf. Three sales is too few to read as a level for that project. Only two neighbours cleared the volume threshold inside the radius, which tells you something about how concentrated resale activity is in this pocket.
| Project | Tenure | TOP | Distance | Resales | Median psf |
|---|---|---|---|---|---|
| Citylife@Tampines | 99-year leasehold | — | 161 m | 24 | S$1,662 psf |
| Pinevale | 99-year leasehold | — | 747 m | 3 | S$1,167 psf |
The largest prices in the window came in at the lowest psf
The top-price table is where the headline tension sits. The highest resale over the window was S$3,500,000 in 2Q2026, for a 2,465 sqft unit on the 11-15 storey range. That works out to S$1,420 psf in the table, below the project's four-quarter median. The next three by price are all from the same storey band: S$2,880,000 in 1Q2026 at S$1,462 psf, S$2,870,000 in 4Q2025 at S$1,353 psf, and S$2,868,888 in 3Q2025 at S$1,456 psf.
The fifth row breaks the pattern. A 1,302 sqft unit on the 06-10 storey range sold for S$2,310,000 in 1Q2026, at S$1,774 psf. It is the smallest area on the list and the highest psf on it. So the quantum leaders and the psf leaders are different units entirely. Anyone reading only the project median would miss that. Anyone reading only the record price would miss it too.
| Quarter | Storey range | Area | Price | Per sqft |
|---|---|---|---|---|
| Q2 2026 | 11-15 | 2,465 sqft | S$3,500,000 | S$1,420 psf |
| Q1 2026 | 11-15 | 1,970 sqft | S$2,880,000 | S$1,462 psf |
| Q4 2025 | 11-15 | 2,120 sqft | S$2,870,000 | S$1,353 psf |
| Q3 2025 | 11-15 | 1,970 sqft | S$2,868,888 | S$1,456 psf |
| Q1 2026 | 06-10 | 1,302 sqft | S$2,310,000 | S$1,774 psf |
Our own estimate here missed by a median of 3.7% when tested against later sales
We backtest the estimate against sales that happened after it was made. At The Tampines Trilliant, as of 4Q2025, it was tested against 42 later sales. The median error was 3.7%. Of those sales, 36% landed inside the stated range. That is the model's record at this project, not a claim about any single unit.
Two things follow from that. A median error near 3.7% is a middle-of-the-pack reading across a project with steady volume. The share landing inside the range is the stricter test, and it shows where the spread is tighter than the sales are. Our estimate is a modelled figure built from recorded transactions. It is not a valuation of any home, and it does not replace one.
Some things the figures leave open. The last two quarters are close together, S$1,744 psf and S$1,748 psf. Whether that is a plateau or a pause is not something eight quarters of small counts can answer. The size mix is worth tracking too. The 90 to 119 sqm band carried most of the volume this window. If that share shifts, the project median moves with it, even at steady prices. On the rental side, the rate has been flat while contract counts have swung. Next quarter's data will show whether both settle.
One number rarely tells you much on its own here. The +15.6% climb and the S$1,420 psf top sale are both true, and they come from the same set of caveats. The value is in reading them together, against the district and the two neighbours, and knowing how thin each row really is.
Method: URA resale caveats at the project (developer sales and sub-sales excluded) by the quarter of the sale month. Size bands by caveated floor area. Rents are URA rental contracts at the project, and the gross yield is the mean of the quarterly median rents per square foot, annualised, over the four-quarter resale median per square foot, before any cost. Lease left is the tenure less the years since the lease started, as recorded. The estimate accuracy is this site's backtest: the engine run as of the quarter named, compared with the sales since. Private figures are from URA Data Service caveats, HDB figures from data.gov.sg resale records, both loaded weekly by this site's ingest. Medians are of the non-excluded transactions in the period named. Sales flagged by the hygiene rules (related-party transfers, bulk deals, outliers) are left out. Every figure is indicative and drawn from recorded transactions, not a formal valuation.