The Tampines Trilliant Resales Reached $1,798 psf In 3Q2026 — While Rents Sit At $4,300 A Month
Published 18 Nov 2026 · The Tampines Trilliant
Resale prices at this EC have edged up quarter after quarter, while rents have stayed in a narrow band. We looked at what each side of that picture shows, and what it leaves open.
According to URA Data Service caveats, The Tampines Trilliant is a 99-year EC in District 18 with 84 years of lease left. It recorded 51 resales over 4Q2025 to 3Q2026 at a median of $1,747 psf. Across the eight quarters shown, the quarterly median moved +11.6%, from $1,611 psf in 4Q2024 to $1,798 psf in 3Q2026. Rental contracts in 3Q2026 point to a gross yield of about 2.9%.
The quarterly median has climbed in every quarter shown, from the first to the last
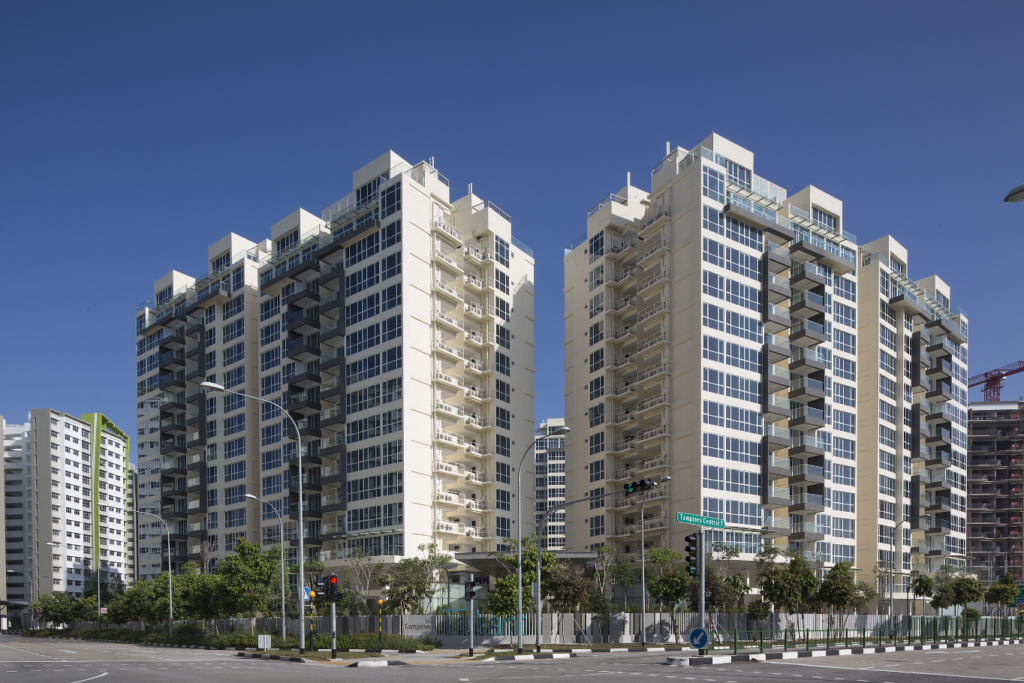
We start with the chart below, which plots the median resale psf at The Tampines Trilliant for each of the eight quarters. The line begins at $1,611 psf in 4Q2024 on 10 sales. It ends at $1,798 psf in 3Q2026 on 12 sales. Along the way it passes $1,688 psf in 1Q2025, $1,699 psf in 3Q2025 and $1,744 psf in 1Q2026. Each quarter's median is at or above the one before it. The step from 1Q2025 to 2Q2025 is the smallest on the line. The photo shows the project as supplied by the developer, Sim Lian Group Limited. Every point comes from recorded transactions, so the line is indicative and not a formal valuation of any home.
The table below adds the sales counts and the quarterly spread. Counts ran from 9 resales in 1Q2025 to 16 in 2Q2026, so each median rests on a modest sample. The lower quartile in 4Q2025 was $1,465 psf, well under the $1,725 psf median that quarter and under the lower quartile of every other quarter. The upper quartile that quarter was $1,757 psf. In 3Q2026 the range ran from $1,701 psf to $1,829 psf. The table cannot show whether the wider 4Q2025 spread reflects a different mix of units, floors or something else. Medians move with whichever units happen to trade in a given quarter.
| Quarter | Resales | Median psf | 25th percentile | 75th percentile |
|---|---|---|---|---|
| Q4 2024 | 10 | S$1,611 psf | S$1,573 psf | S$1,651 psf |
| Q1 2025 | 9 | S$1,688 psf | S$1,656 psf | S$1,700 psf |
| Q2 2025 | 15 | S$1,689 psf | S$1,648 psf | S$1,733 psf |
| Q3 2025 | 10 | S$1,699 psf | S$1,685 psf | S$1,757 psf |
| Q4 2025 | 13 | S$1,725 psf | S$1,465 psf | S$1,757 psf |
| Q1 2026 | 10 | S$1,744 psf | S$1,724 psf | S$1,764 psf |
| Q2 2026 | 16 | S$1,748 psf | S$1,727 psf | S$1,808 psf |
| Q3 2026 | 12 | S$1,798 psf | S$1,701 psf | S$1,829 psf |
Mid-sized units made up most of the resales, and the smaller units carry the higher psf
The table below splits the resales from 4Q2025 to 3Q2026 by unit size. Units of 90 to 119 sqm were the most traded size, with 28 resales at a median of $1,864,000 ($1,743 psf). Their median area was 1,130 sqft. The 120 sqm and above band had 15 resales at a median of $2,325,000 ($1,718 psf), on a median area of 1,302 sqft. The smallest band, 70 to 89 sqm, had 8 resales at a median of $1,600,000 ($1,835 psf) and a median area of 872 sqft. Across the three bands, the total price rises with size while the psf figure falls. That pattern holds in every step of the table.
The 8 resales in the smallest band are a thin base. The $1,835 psf there could shift with a few more sales. The table also does not show floor level or facing, so the gap in psf between the bands may partly reflect which units happened to trade. What the figures do show is that the middle band carries the bulk of the volume, and its median psf sits between the other two.
| Size band | Resales | Median area | Median price | Median psf |
|---|---|---|---|---|
| 70 to 89 sqm | 8 | 872 sqft | S$1,600,000 | S$1,835 psf |
| 90 to 119 sqm | 28 | 1,130 sqft | S$1,864,000 | S$1,743 psf |
| 120 sqm and above | 15 | 1,302 sqft | S$2,325,000 | S$1,718 psf |
The project sits above its district median and above both neighbours within 1 km
Over the same four quarters, the District 18 resale median was $1,467 psf from 1,051 sales. The Tampines Trilliant sits +19.1% against it. That comparison covers the whole district, which holds many project types and ages. It tells you where this project's median lands against a wide pool of sales. It does not tell you how it compares with any one comparable development.
The table below narrows the view to projects within 1 km. Citylife@Tampines is the closest, at 161 m, with 28 resales at a median of $1,670 psf. Pinevale is 747 m away, with 5 resales at a median of $1,167 psf. Both are listed as 99-year leasehold, and the table shows no TOP year for either. Five sales is a small count, so the Pinevale figure is a loose guide at best. The table also cannot show differences in unit size or age between the three projects, and those could account for part of each gap.
| Project | Tenure | TOP | Distance | Resales | Median psf |
|---|---|---|---|---|---|
| Citylife@Tampines | 99-year leasehold | — | 161 m | 28 | S$1,670 psf |
| Pinevale | 99-year leasehold | — | 747 m | 5 | S$1,167 psf |
Rents held near $4,300 a month while the psf rent edged up in 3Q2026
The table below lists URA rental contracts at The Tampines Trilliant for the last four quarters. Contract counts were 34 in 4Q2025, 26 in 1Q2026, 17 in 2Q2026 and 35 in 3Q2026. The median rent was $4.2 psf a month in the first three quarters and $4.4 psf in 3Q2026. The median monthly rent was $4,300 in 4Q2025, $4,275 in 1Q2026, $4,400 in 2Q2026 and $4,300 in 3Q2026.
In 3Q2026 there were 35 contracts at a median of $4.38 psf a month, with a median rent of $4,300. Set against the resale median, this site's engine puts the gross yield at about 2.9%. The monthly figure was the same in 4Q2025 and 3Q2026, while the psf figure moved. The table does not show the size of the units leased, so it cannot settle why the two measures differ. The 17 contracts in 2Q2026 are also the thinnest quarter in the table.
| Quarter | Contracts | Median rent (S$ psf a month) | Median monthly rent |
|---|---|---|---|
| Q4 2025 | 34 | 4.2 | S$4,300 |
| Q1 2026 | 26 | 4.2 | S$4,275 |
| Q2 2026 | 17 | 4.2 | S$4,400 |
| Q3 2026 | 35 | 4.4 | S$4,300 |
The highest resale prices all came from large units in the 11-15 storey range
The table below lists the highest resale prices in the window. The top sale was $3,500,000 in 2Q2026 for a 2,465 sqft unit in the 11-15 storey range, at $1,420 psf. Next came $3,050,000 in 3Q2026 for 1,970 sqft ($1,548 psf), then two sales of $3,000,000 for 2,120 sqft ($1,415 psf each). The fifth row is $2,880,000 in 1Q2026 for 1,970 sqft ($1,462 psf).
Every row in the table is from the 11-15 storey range, and every one is a large unit. The psf figures here all sit below the project's median psf for the window. Large units tend to carry a lower psf in this project, as the size table above also shows. Two rows match on every column, and the data does not show whether they are separate units. These are the top of the range and say little about a typical sale.
| Quarter | Storey range | Area | Price | Per sqft |
|---|---|---|---|---|
| Q2 2026 | 11-15 | 2,465 sqft | S$3,500,000 | S$1,420 psf |
| Q3 2026 | 11-15 | 1,970 sqft | S$3,050,000 | S$1,548 psf |
| Q3 2026 | 11-15 | 2,120 sqft | S$3,000,000 | S$1,415 psf |
| Q3 2026 | 11-15 | 2,120 sqft | S$3,000,000 | S$1,415 psf |
| Q1 2026 | 11-15 | 1,970 sqft | S$2,880,000 | S$1,462 psf |
Our estimate tested at a median error of 3.2% here, with 28% of sales inside its range
We also test how this site's estimate has performed at each project. As of 1Q2026, we tested it against 40 later sales at The Tampines Trilliant. The median error was 3.2%. Of those sales, 28% fell inside the stated range.
Those two figures describe different things. The median error shows how close the central estimate sat to recorded prices. The share inside the range shows how often the stated band caught the sale. The estimate is indicative and built from recorded transactions. It is not a formal valuation of any home.
The figures leave a few things open. The quarterly counts are modest, so the 3Q2026 median of $1,798 psf is one data point from 12 sales. The rental series has a thin 2Q2026 quarter. The gross yield comes from one quarter of rents set against the resale median. In the next quarter's data, we will look at whether the resale line keeps its direction, how the 4Q2025-style spread behaves, and whether the psf rent holds at its new level.
A single headline rarely tells you enough on its own. A median, a yield or a record price only means something once you see how it sits beside the counts, the sizes and the neighbours. For us, the value lies in how each figure fits the broader direction of the market over several quarters.
Method: URA resale caveats at the project (developer sales and sub-sales excluded) by the quarter of the sale month. Size bands by caveated floor area. Rents are URA rental contracts at the project, and the gross yield is the mean of the quarterly median rents per square foot, annualised, over the four-quarter resale median per square foot, before any cost. Lease left is the tenure less the years since the lease started, as recorded. The estimate accuracy is this site's backtest: the engine run as of the quarter named, compared with the sales since. Private figures are from URA Data Service caveats, HDB figures from data.gov.sg resale records, both loaded weekly by this site's ingest. Medians are of the non-excluded transactions in the period named. Sales flagged by the hygiene rules (related-party transfers, bulk deals, outliers) are left out. Every figure is indicative and drawn from recorded transactions, not a formal valuation. Facilities, layouts and photographs, where shown, are as supplied by the developer or seen on our own visit, and are not engine data.