The Florence Residences Logged 91 Resales At A Median Of S$1,881 psf — And The Quarter With The Most Sales Was Also The Priciest
Published 26 Sept 2026 · The Florence Residences
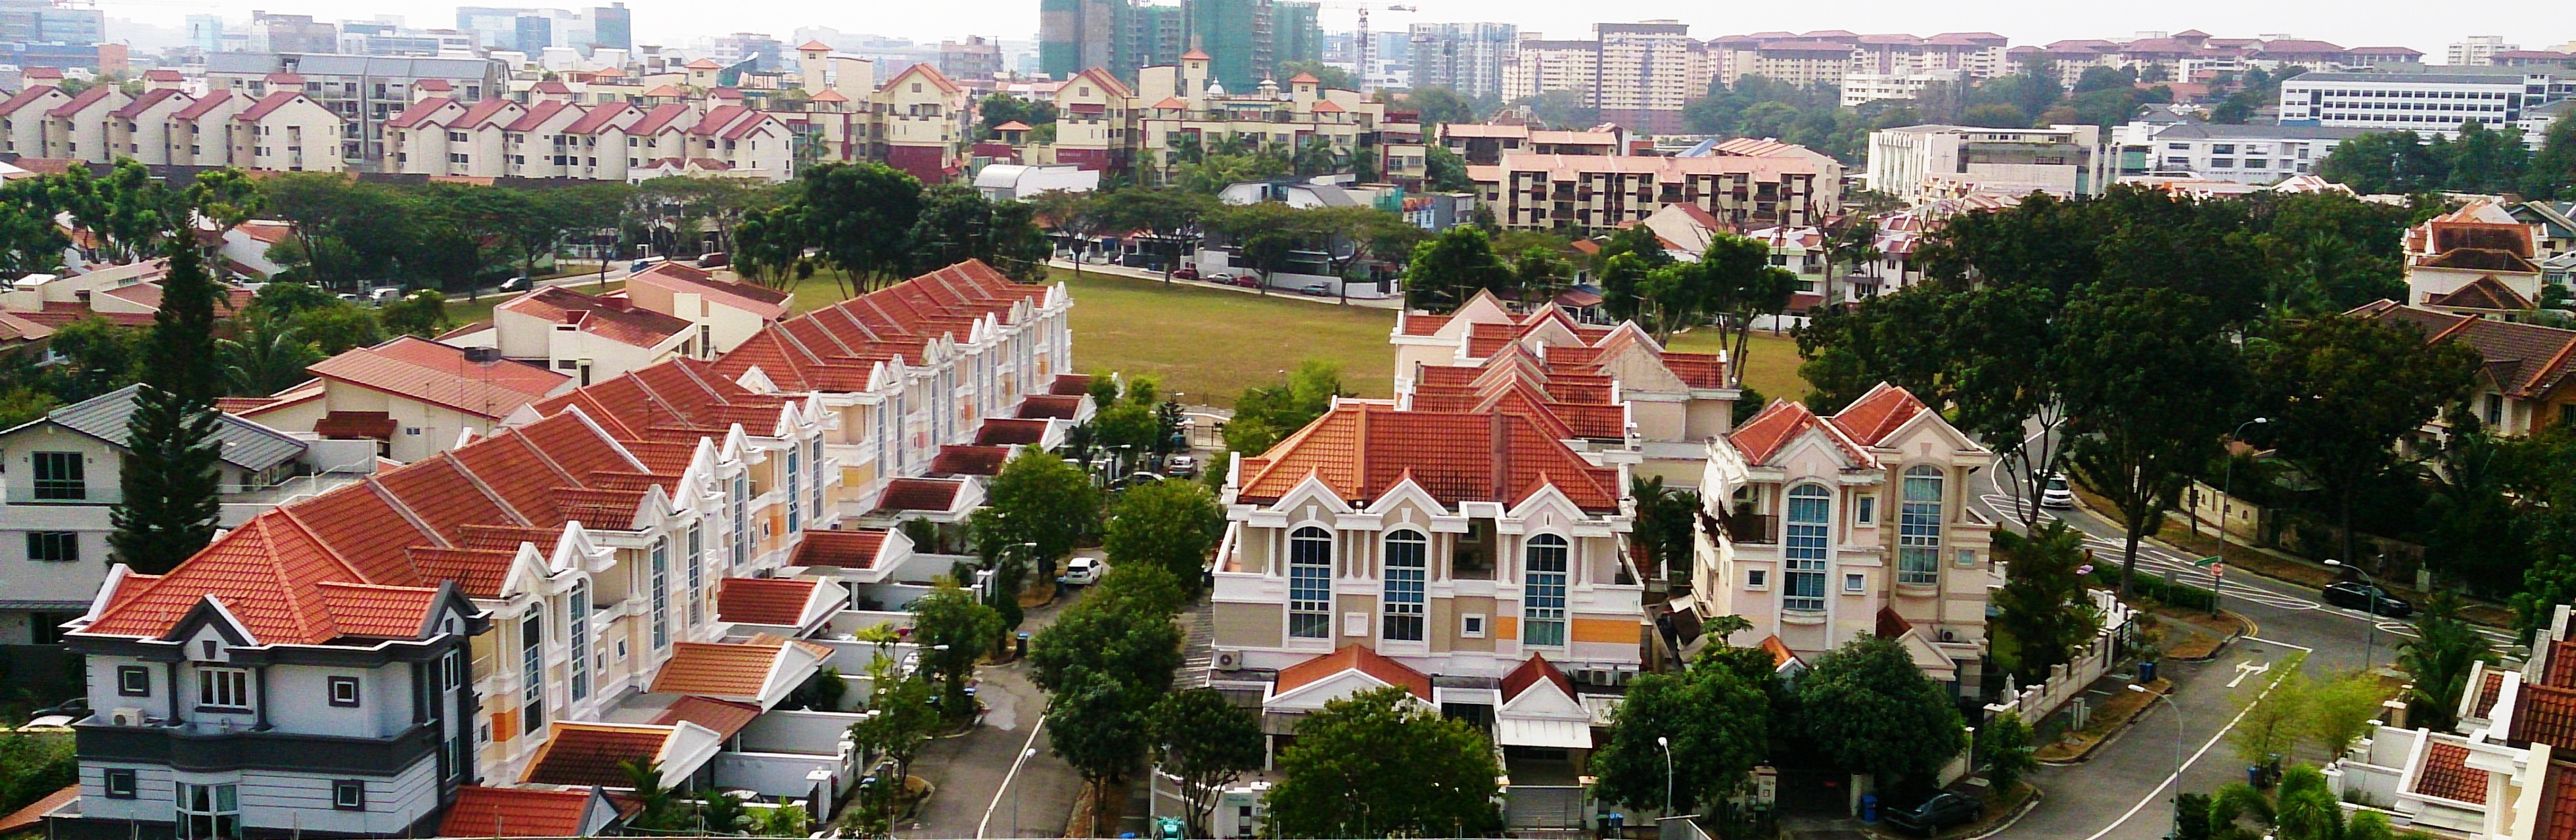
A project can trade heavily and still go nowhere on price. The Florence Residences did not do that over the past year. Volume was heavy, and the quarterly median ended the window higher than it started. That combination is worth a closer look. The sizes trading are not evenly spread across the project. Small units make up a large share of the deal count. The larger units carry the higher psf figures. So the project median is doing two jobs at once. It tracks price, and it also tracks whatever mix happened to transact in a given quarter. Here is what stood out to us in the tables.
According to URA Data Service caveats, The Florence Residences recorded 91 resales from Q3 2025 to Q2 2026. The median across those deals was S$1,881 psf. Over the five quarters in our table, the quarterly median moved +6.4%. It went from S$1,834 psf in 2Q2025, on 9 sales, to S$1,951 psf in 2Q2026, on 35 sales. The project is a 99-year leasehold apartment development in District 19, with 91 years of lease left. Over the same four quarters, the district resale median was S$1,644 psf across 2,311 sales. That places the project +14.4% against its own district.
The quarterly median finished the window at the highest level of the five quarters shown
The path was not a straight line. The median dipped to S$1,788 psf in 3Q2025, on 24 sales. It then lifted to S$1,900 psf in 4Q2025, but on only 12 sales. 1Q2026 came in a shade lower at S$1,877 psf, on 20 sales. The strongest reading and the heaviest quarter arrived together in 2Q2026. Quarters with 9 or 12 deals sit on thin ground, so the wobble in the middle of the window may say as much about mix as about pricing.
The spread inside each quarter is the other thing worth reading. In 2Q2026 the lower and upper columns in the table below run from S$1,831 psf to S$1,997 psf. That is a wider band than 4Q2025, where the same columns sit at S$1,842 psf and S$1,969 psf. A higher median with a wider band points to a broader mix of unit types clearing in the same three months. The chart below shows the same series with the sale counts attached, which is the fairer way to read it.
| Quarter | Resales | Median psf | 25th percentile | 75th percentile |
|---|---|---|---|---|
| Q2 2025 | 9 | S$1,834 psf | S$1,774 psf | S$1,894 psf |
| Q3 2025 | 24 | S$1,788 psf | S$1,730 psf | S$1,912 psf |
| Q4 2025 | 12 | S$1,900 psf | S$1,842 psf | S$1,969 psf |
| Q1 2026 | 20 | S$1,877 psf | S$1,834 psf | S$1,943 psf |
| Q2 2026 | 35 | S$1,951 psf | S$1,831 psf | S$1,997 psf |
The most traded size band is not the one with the highest psf
Units of 50 to 69 sqm were the busiest band. There were 35 resales there, at a median of S$1,250,000, or S$1,872 psf. That is below the project median for the window. The under 50 sqm band was cheaper still on a psf basis, at S$1,755 psf, with a median price of S$855,000 across 19 resales. So the two smallest bands together account for a large share of the 91 deals.
The higher psf figures sit further up the size table. The 70 to 89 sqm band recorded 13 resales at S$1,976 psf, with a median price of S$1,825,000. The 90 to 119 sqm band posted the highest psf of the five, at S$1,996 psf, across 19 resales at a median of S$2,025,000. The largest band, 120 sqm and above, came in at S$1,966 psf on just 5 resales.
That pattern matters for how you read the headline number. If a quarter happens to clear more large units, the project median moves up without any single unit type repricing. Five deals in the top band is far too few to draw a trend from. The table below sets the bands side by side.
| Size band | Resales | Median area | Median price | Median psf |
|---|---|---|---|---|
| under 50 sqm | 19 | 484 sqft | S$855,000 | S$1,755 psf |
| 50 to 69 sqm | 35 | 667 sqft | S$1,250,000 | S$1,872 psf |
| 70 to 89 sqm | 13 | 926 sqft | S$1,825,000 | S$1,976 psf |
| 90 to 119 sqm | 19 | 1,012 sqft | S$2,025,000 | S$1,996 psf |
| 120 sqm and above | 5 | 1,668 sqft | S$3,280,000 | S$1,966 psf |
The ceiling for the window was set in 2Q2026 at S$3,400,000
The highest recorded resale in the four quarters was S$3,400,000. It was a 1,679 sqft unit in the 11-15 storey range, transacted in 2Q2026 at S$2,025 psf. That is the only figure in the top five to clear S$2,000 psf. The next highest price was S$3,300,000 in 4Q2025, for a 1,668 sqft unit on the same storey band, at S$1,978 psf.
Three of the five largest deals fell in 2Q2026, which is consistent with that quarter carrying the most sales overall. A 1,668 sqft unit in the 06-10 range went for S$3,280,000, or S$1,966 psf. A 1,389 sqft unit in the 01-05 range matched that psf at S$2,730,000. The 1Q2026 entry, at S$3,260,000 for 1,679 sqft, works out to S$1,941 psf. These are recorded caveats, not valuations of any home. The table below lists them in order of price.
| Quarter | Storey range | Area | Price | Per sqft |
|---|---|---|---|---|
| Q2 2026 | 11-15 | 1,679 sqft | S$3,400,000 | S$2,025 psf |
| Q4 2025 | 11-15 | 1,668 sqft | S$3,300,000 | S$1,978 psf |
| Q2 2026 | 06-10 | 1,668 sqft | S$3,280,000 | S$1,966 psf |
| Q1 2026 | 11-15 | 1,679 sqft | S$3,260,000 | S$1,941 psf |
| Q2 2026 | 01-05 | 1,389 sqft | S$2,730,000 | S$1,966 psf |
Rents have held in a tight band while the number of contracts moved around
The rental side looks steadier than the resale side. URA rental contracts at the project ran at a median of S$5.23 psf a month in 2Q2026, across 70 contracts. The median monthly rent was S$3,325. The three quarters before that sat in the same narrow range. 3Q2025 recorded 47 contracts at S$5.3 psf a month, and 4Q2025 recorded 76 at S$5.2 psf a month.
The count is the part that swings. Contracts rose to 89 in 1Q2026, the highest in the table, at S$5.4 psf a month. Median monthly rent barely moved across all four quarters, holding between S$3,300 and S$3,350. Measured against the resale median for the window, the 2Q2026 rent median gives a gross yield of about 3.4%. That is our own engine's figure, taken from recorded rents and recorded resale prices, before any costs. The table below shows the four quarters together.
| Quarter | Contracts | Median rent (S$ psf a month) | Median monthly rent |
|---|---|---|---|
| Q3 2025 | 47 | 5.3 | S$3,350 |
| Q4 2025 | 76 | 5.2 | S$3,300 |
| Q1 2026 | 89 | 5.4 | S$3,300 |
| Q2 2026 | 70 | 5.2 | S$3,325 |
Within 1 km, project medians run from S$1,472 psf to S$2,399 psf
The neighbourhood is not priced as one block. The widest gap in the table below is between Kovan Grandeur at S$1,472 psf, on 8 resales, and Parry Park at S$2,399 psf, on 6. Both counts are small, so neither number should carry much weight on its own. Parry Park is also the only 999-year leasehold project in the set.
Among the busier neighbours, Kovan Melody recorded 22 resales at S$1,792 psf, 792 m away. Stars Of Kovan posted 19 resales at S$1,950 psf, and Kovan Residences 15 at S$1,888 psf. The Tembusu, the one freehold project listed, recorded 17 resales at S$1,976 psf. The closest project in the set is Kovan Regency, 393 m away, at S$2,000 psf on 11 resales. Tenure, age and size mix all differ across these projects, and the table does not separate them out. What it does show is where The Florence Residences median sits within that range.
| Project | Tenure | TOP | Distance | Resales | Median psf |
|---|---|---|---|---|---|
| Kovan Melody | 99-year leasehold | — | 792 m | 22 | S$1,792 psf |
| Stars Of Kovan | 99-year leasehold | — | 625 m | 19 | S$1,950 psf |
| The Tembusu | freehold | — | 717 m | 17 | S$1,976 psf |
| Kovan Residences | 99-year leasehold | — | 671 m | 15 | S$1,888 psf |
| Kovan Regency | 99-year leasehold | — | 393 m | 11 | S$2,000 psf |
| Kovan Grandeur | 99-year leasehold | — | 961 m | 8 | S$1,472 psf |
| Park Villas | 99-year leasehold | — | 716 m | 6 | S$1,712 psf |
| Parry Park | 999-year leasehold | — | 771 m | 6 | S$2,399 psf |
Our own estimate missed by a median of 5.8% when tested against later sales here
We also check our estimate against what actually transacted. As of 4Q2025, we tested it against 78 later sales at The Florence Residences. The median error came out at 5.8%. Just 37% of those sales landed inside the stated range. That is the honest read on how tightly our model tracks this particular project.
It is a useful caveat to carry through the rest of these numbers. A project with a wide spread of unit sizes is harder to pin down than one with a narrow one. The size bands above show why. The psf figures move across the bands, and the mix shifts from quarter to quarter. Every figure in this piece comes from recorded transactions, not from a formal valuation of any unit.
A few things the tables cannot settle. We do not know how much of the move from S$1,834 psf to S$1,951 psf reflects pricing, and how much reflects the sizes that happened to clear in each quarter. The thin quarters in the middle of the window, at 9 and 12 sales, make that harder to separate. The rent series is the cleaner one to follow, since the median held within a narrow range across four quarters while contract counts swung from 47 to 89. Next quarter's caveats will show whether the 2Q2026 reading holds with a different mix behind it, and whether the district median of S$1,644 psf moves with it or apart from it.
One quarter of data rarely settles anything by itself, and this project is a good example of why. The median is a single line sitting on top of five size bands that behave differently. Read it next to the counts, the spread and the neighbours, and it tells you something. Read it alone, and it mostly tells you what sold.
Method: URA resale caveats at the project (developer sales and sub-sales excluded) by the quarter of the sale month. Size bands by caveated floor area. Rents are URA rental contracts at the project, and the gross yield is the mean of the quarterly median rents per square foot, annualised, over the four-quarter resale median per square foot, before any cost. Lease left is the tenure less the years since the lease started, as recorded. The estimate accuracy is this site's backtest: the engine run as of the quarter named, compared with the sales since. Private figures are from URA Data Service caveats, HDB figures from data.gov.sg resale records, both loaded weekly by this site's ingest. Medians are of the non-excluded transactions in the period named. Sales flagged by the hygiene rules (related-party transfers, bulk deals, outliers) are left out. Every figure is indicative and drawn from recorded transactions, not a formal valuation.