The Bayshore Has Barely Moved In Two Years — 40 Resales At A Median Of S$1,390 psf, And 10.1% Below Its Own District
Published 13 Oct 2026 · The Bayshore
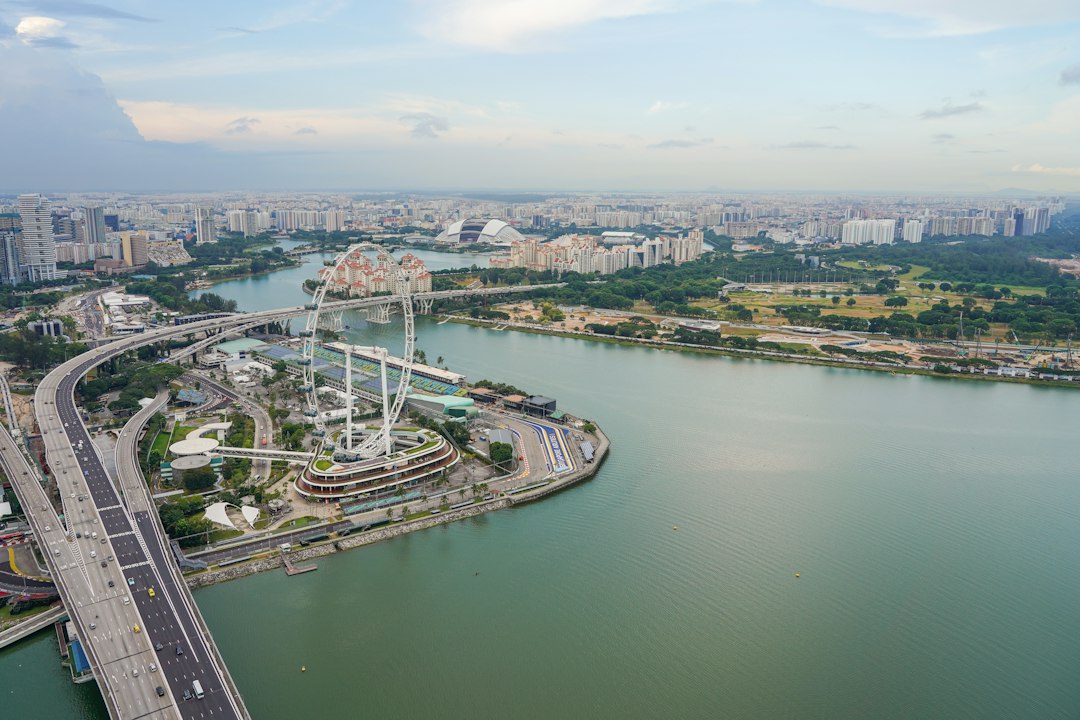
Some projects tell a story through swings. The Bayshore tells one through how little it moves. Eight quarters of resale data, and the median sits close to where it started.
According to URA Data Service caveats, The Bayshore recorded 40 resales over Q3 2025 to Q2 2026. The median was S$1,390 psf. Across the eight quarters shown, the quarterly median moved -2.1%. It went from S$1,391 psf in 3Q2024, on 10 sales, to S$1,362 psf in 2Q2026, also on 10 sales. The project is a 99-year leasehold condo in District 16, with 66 years of lease left.
The quarterly line has stayed inside a narrow band for two years
Here is what stood out to us first. Over eight quarters, no single quarter breaks far from the rest. The low is S$1,355 psf in 2Q2025. The high is S$1,419 psf in 3Q2025. Those two sit one quarter apart, which is worth noting. The 3Q2025 reading came off just 6 sales.
Volume is the part that moves. Quarterly counts run from 6 to 15. The busiest quarter was 1Q2026, with 15 resales at a median of S$1,397 psf. The quietest were 2Q2025 and 3Q2025, with 6 each. With counts that small, one high-floor or low-floor deal can shift a median. So we would read the quarter-to-quarter wiggles lightly.
The spreads help here. In 4Q2025, the 25th and 75th percentiles were S$1,374 psf and S$1,404 psf. That is a tight quarter. In 2Q2026, the same pair reads S$1,352 psf and S$1,459 psf. A wider quarter, on the same kind of volume.
| Quarter | Resales | Median psf | 25th percentile | 75th percentile |
|---|---|---|---|---|
| Q3 2024 | 10 | S$1,391 psf | S$1,338 psf | S$1,443 psf |
| Q4 2024 | 13 | S$1,364 psf | S$1,309 psf | S$1,429 psf |
| Q1 2025 | 8 | S$1,398 psf | S$1,362 psf | S$1,417 psf |
| Q2 2025 | 6 | S$1,355 psf | S$1,330 psf | S$1,380 psf |
| Q3 2025 | 6 | S$1,419 psf | S$1,391 psf | S$1,487 psf |
| Q4 2025 | 9 | S$1,387 psf | S$1,374 psf | S$1,404 psf |
| Q1 2026 | 15 | S$1,397 psf | S$1,333 psf | S$1,430 psf |
| Q2 2026 | 10 | S$1,362 psf | S$1,352 psf | S$1,459 psf |
Bigger units at The Bayshore traded at a higher psf than smaller ones
The size table runs against the usual pattern. Smaller units often carry a higher psf. Here they do not. The 70 to 89 sqm band recorded 8 resales at S$1,372 psf, on a median area of 926 sqft. The 120 sqm and above band recorded 8 resales at S$1,401 psf.
Most of the activity sits in the middle. The 90 to 119 sqm band was the most traded size. It logged 24 of the 40 resales. The median price there was S$1,623,000, or S$1,388 psf, on a median area of 1,184 sqft. That band effectively sets the project median.
The two outer bands have 8 sales each. That is thin. Mix within a band matters too, since floor level and stack are not held constant. The table below shows what traded, not a like-for-like comparison.
| Size band | Resales | Median area | Median price | Median psf |
|---|---|---|---|---|
| 70 to 89 sqm | 8 | 926 sqft | S$1,271,000 | S$1,372 psf |
| 90 to 119 sqm | 24 | 1,184 sqft | S$1,623,000 | S$1,388 psf |
| 120 sqm and above | 8 | 1,432 sqft | S$2,005,000 | S$1,401 psf |
Every one of the five highest resales was the same 1,432 sqft size
The top of the price table is unusually uniform. All five of the largest transactions were 1,432 sqft units. The highest was S$2,150,000 in 3Q2025, from the 26-30 storey range, at S$1,502 psf. That is the only sale in the top five from 2025.
The other four all landed in 1Q2026. They came from the 16-20, 21-25, 26-30 and 11-15 storey bands. Prices ran from S$2,000,000 to S$2,060,000. The psf figures across those four sit between S$1,397 psf and S$1,439 psf.
Note what the storey ranges do here. The 26-30 unit in 1Q2026 fetched S$2,010,000. The 11-15 unit in the same quarter fetched S$2,000,000. Height alone does not separate them by much at this project, at least across these five caveats.
| Quarter | Storey range | Area | Price | Per sqft |
|---|---|---|---|---|
| Q3 2025 | 26-30 | 1,432 sqft | S$2,150,000 | S$1,502 psf |
| Q1 2026 | 16-20 | 1,432 sqft | S$2,060,000 | S$1,439 psf |
| Q1 2026 | 21-25 | 1,432 sqft | S$2,038,000 | S$1,424 psf |
| Q1 2026 | 26-30 | 1,432 sqft | S$2,010,000 | S$1,404 psf |
| Q1 2026 | 11-15 | 1,432 sqft | S$2,000,000 | S$1,397 psf |
Rental volume at The Bayshore runs higher than resale volume, quarter after quarter
The rental side is the busier market at this project. In 2Q2026, URA recorded 54 rental contracts. The median rent was S$3,875 a month, or S$3.88 psf a month. Against the resale median, our engine measures a gross yield of about 3.4%.
Across four quarters, the per-square-foot rent barely moves. It reads 3.9, 4.0, 3.9 and 3.9. The headline monthly rent moves a little more. It was S$4,000 in 3Q2025 and 4Q2025, then S$4,150 in 1Q2026, then S$3,875 in 2Q2026. Contract counts ran from 46 to 60.
That gap between a flat psf figure and a moving monthly median usually points to unit mix. Larger units leasing in one quarter lift the dollar rent without moving the psf. The table does not break contracts down by size, so we cannot settle that here.
| Quarter | Contracts | Median rent (S$ psf a month) | Median monthly rent |
|---|---|---|---|
| Q3 2025 | 53 | 3.9 | S$4,000 |
| Q4 2025 | 46 | 4.0 | S$4,000 |
| Q1 2026 | 60 | 3.9 | S$4,150 |
| Q2 2026 | 54 | 3.9 | S$3,875 |
Within one kilometre, the psf range between neighbours is wide
The Bayshore's S$1,390 psf sits in the middle of its immediate surroundings. The nearest project, Costa Del Sol, is 125 m away. It recorded 35 resales at S$1,953 psf, the busiest count in the radius. The Summit, a freehold project 483 m away, recorded 7 resales at S$1,966 psf.
At the other end, Laguna Park logged 12 resales at S$1,167 psf. Casafina recorded 19 at S$1,265 psf. Bayshore Park, 254 m away, recorded 23 at S$1,313 psf. Tenure separates part of the field. The two freehold projects with higher medians are Eastern Lagoon at S$1,656 psf and Parbury Hill Condominium at S$1,661 psf.
Against the wider district, the gap is clearer. District 16 recorded 749 resales over the same four quarters, at a median of S$1,545 psf. The Bayshore sits -10.1% against that. Age and remaining lease differ across the district, and the comparison does not adjust for either.
| Project | Tenure | TOP | Distance | Resales | Median psf |
|---|---|---|---|---|---|
| Costa Del Sol | 99-year leasehold | — | 125 m | 35 | S$1,953 psf |
| Bayshore Park | 99-year leasehold | — | 254 m | 23 | S$1,313 psf |
| Casafina | 99-year leasehold | — | 664 m | 19 | S$1,265 psf |
| Laguna Park | 99-year leasehold | — | 842 m | 12 | S$1,167 psf |
| Eastern Lagoon | freehold | — | 535 m | 12 | S$1,656 psf |
| Laguna Green | 99-year leasehold | — | 507 m | 7 | S$1,386 psf |
| Parbury Hill Condominium | freehold | — | 717 m | 7 | S$1,661 psf |
| The Summit | freehold | — | 483 m | 7 | S$1,966 psf |
Our own estimate at The Bayshore was tested against 47 later sales
We also check how our estimate has performed at this project. As of 4Q2025, it was tested against 47 later sales at The Bayshore. The median error came to 4.0%. Of those sales, 47% landed inside the stated range.
Those are indicative figures from recorded transactions, not a valuation of any home. A tight price band, as this project has, tends to make a median easier to track. The share falling inside the range is the number we watch more closely than the median error.
A few things the data does not settle. The quarterly counts here are small, so single caveats carry weight in any one median. The size bands at either end have 8 sales each. The rental table gives no unit-size split, so the move in monthly rent between 1Q2026 and 2Q2026 cannot be pinned to mix or to price. What we would watch in the next quarter's data is whether 2Q2026's wider percentile spread narrows again, and whether volume stays near the 1Q2026 level.
One quarter at one project rarely says much on its own. The value is in the shape over time. Here that shape is a project holding a narrow band across two years, trading below its district median, and leasing more often than it sells. Read against the neighbours in the table, that is the more useful picture.
Method: URA resale caveats at the project (developer sales and sub-sales excluded) by the quarter of the sale month. Size bands by caveated floor area. Rents are URA rental contracts at the project, and the gross yield is the mean of the quarterly median rents per square foot, annualised, over the four-quarter resale median per square foot, before any cost. Lease left is the tenure less the years since the lease started, as recorded. The estimate accuracy is this site's backtest: the engine run as of the quarter named, compared with the sales since. Private figures are from URA Data Service caveats, HDB figures from data.gov.sg resale records, both loaded weekly by this site's ingest. Medians are of the non-excluded transactions in the period named. Sales flagged by the hygiene rules (related-party transfers, bulk deals, outliers) are left out. Every figure is indicative and drawn from recorded transactions, not a formal valuation.