Symphony Suites Posted 38 Resales At A Median Of S$1,367 psf — And Its Quarterly Median Has Barely Moved Since 3Q2025
Published 21 Oct 2026 · Symphony Suites
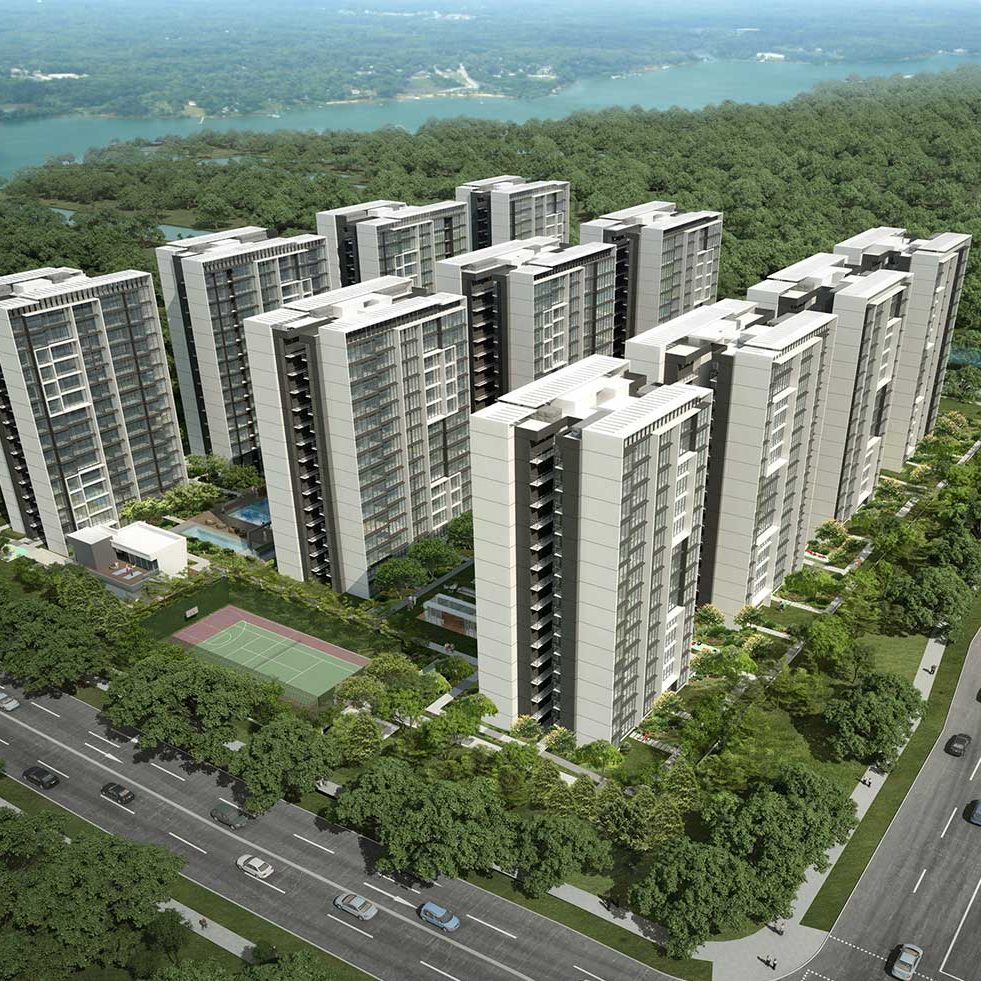
A project can look like it is climbing steadily, right up until you line the quarters up side by side. Symphony Suites is one of those cases. The eight-quarter move is clearly positive. The last four quarters are almost flat.
According to URA Data Service caveats, Symphony Suites recorded 38 resales over 3Q2025 to 2Q2026, at a median of S$1,367 psf. The quarterly median rose 7.2% across the eight quarters shown, from S$1,279 psf in 3Q2024 to S$1,371 psf in 2Q2026. Both of those quarters had 10 sales. The project is a 99-year leasehold condo in District 27, with 87 years of lease left.
Most of the eight-quarter gain happened before 3Q2025, and the last four quarters sit within a narrow band
Here is what stood out to us first. The median went from S$1,279 psf in 3Q2024 to S$1,366 psf in 3Q2025. After that, it reads S$1,364 psf, then S$1,370 psf, then S$1,371 psf. Three quarters, almost no movement.
Counts matter here. 4Q2025 had only 4 resales, the thinnest quarter in the table. A median off 4 sales can swing on which stacks happened to transact. The fuller quarters are 2Q2025 with 15 sales and 3Q2025 with 14. Those two bracket the point where the series flattens.
The percentile columns give some sense of the spread. In 2Q2026 the quarter's range runs from S$1,347 psf to S$1,388 psf. In 4Q2025, the thin quarter, it runs wider, from S$1,322 psf to S$1,409 psf. Fewer sales, wider spread. That is what you would expect, and it is a reason to read that one quarter lightly.
The table and chart below show the full run.
| Quarter | Resales | Median psf | 25th percentile | 75th percentile |
|---|---|---|---|---|
| Q3 2024 | 10 | S$1,279 psf | S$1,265 psf | S$1,320 psf |
| Q4 2024 | 8 | S$1,335 psf | S$1,308 psf | S$1,353 psf |
| Q1 2025 | 12 | S$1,338 psf | S$1,329 psf | S$1,362 psf |
| Q2 2025 | 15 | S$1,330 psf | S$1,305 psf | S$1,363 psf |
| Q3 2025 | 14 | S$1,366 psf | S$1,351 psf | S$1,380 psf |
| Q4 2025 | 4 | S$1,364 psf | S$1,322 psf | S$1,409 psf |
| Q1 2026 | 10 | S$1,370 psf | S$1,341 psf | S$1,400 psf |
| Q2 2026 | 10 | S$1,371 psf | S$1,347 psf | S$1,388 psf |
The most traded size band is also the cheapest one on a psf basis
Split the 38 resales by size and the mix is uneven. Units of 70 to 89 sqm account for 20 of them, at a median of S$1,099,000 (S$1,340 psf). That is the busiest band by some distance.
The smaller and larger bands both price higher per square foot. The 50 to 69 sqm band shows 7 resales at a median of S$955,000 (S$1,386 psf). The 90 to 119 sqm band shows 11 resales at a median of S$1,420,000 (S$1,389 psf). So the middle band sits below both ends on psf, while the big band carries the highest absolute price.
That pattern is worth holding in mind when you read the project median. The 70 to 89 sqm band makes up the bulk of the count. Its psf pulls the overall figure toward S$1,340 psf territory. A quarter weighted differently would print a different median, without any single unit changing in price. The table below sets out the three bands.
| Size band | Resales | Median area | Median price | Median psf |
|---|---|---|---|---|
| 50 to 69 sqm | 7 | 689 sqft | S$955,000 | S$1,386 psf |
| 70 to 89 sqm | 20 | 797 sqft | S$1,099,000 | S$1,340 psf |
| 90 to 119 sqm | 11 | 1,023 sqft | S$1,420,000 | S$1,389 psf |
The top five resales are all the same floor area, and four of them sit on the same floor band
The highest resale price in the window was S$1,450,000 in 4Q2025, for a 1,023 sqft unit on the 11-15 storey range, or S$1,418 psf. Below it, the list is remarkably uniform.
All five of the top sales are 1,023 sqft. Four of the five are on the 11-15 storey range. The fifth, at S$1,420,000 in 1Q2026, sits on the 01-05 range at S$1,389 psf. The psf figures across the five run from S$1,389 psf to S$1,418 psf. That is a tight band for the top end of a project.
It also tells you something about what trades at the top here. The ceiling at Symphony Suites, over these four quarters, is set by one floor area. There is no larger format in the top-five list at all. The table below lists them in order.
| Quarter | Storey range | Area | Price | Per sqft |
|---|---|---|---|---|
| Q4 2025 | 11-15 | 1,023 sqft | S$1,450,000 | S$1,418 psf |
| Q1 2026 | 11-15 | 1,023 sqft | S$1,440,000 | S$1,408 psf |
| Q4 2025 | 11-15 | 1,023 sqft | S$1,438,000 | S$1,406 psf |
| Q3 2025 | 11-15 | 1,023 sqft | S$1,428,000 | S$1,396 psf |
| Q1 2026 | 01-05 | 1,023 sqft | S$1,420,000 | S$1,389 psf |
Rental contracts jumped to 49 in 2Q2026, the busiest quarter in the rental table
URA rental contracts at Symphony Suites in 2Q2026 number 49. The three quarters before it show 32, 32 and 21. So the latest quarter is well ahead of the rest of the run.
The median rent in 2Q2026 was S$4.67 psf a month, with a median monthly rent of S$3,500. Both are the highest readings in the table. The psf figure had sat at 4.4 in 3Q2025 and again in 1Q2026, with 4.6 in between. Median monthly rent moved from S$3,300 to S$3,275, then S$3,450, then S$3,500.
Set that 2Q2026 median rent against the resale median and our engine measures a gross yield of about 4.0%. That is an indicative figure from recorded transactions, not a valuation of any particular unit. The rental approvals and the caveats are separate datasets, and the units behind each are not the same units. The quarterly rental table is below.
| Quarter | Contracts | Median rent (S$ psf a month) | Median monthly rent |
|---|---|---|---|
| Q3 2025 | 32 | 4.4 | S$3,300 |
| Q4 2025 | 32 | 4.6 | S$3,275 |
| Q1 2026 | 21 | 4.4 | S$3,450 |
| Q2 2026 | 49 | 4.7 | S$3,500 |
Symphony Suites prices 2.2% above its district, and the one nearby project in the data sits below both
Over 3Q2025 to 2Q2026, the District 27 resale median was S$1,337 psf, from 619 sales. Symphony Suites sits 2.2% above that. A gap that size is modest against a district sample of that depth.
Within 1 km, the caveats show only one other project with resales in the window. Nine Residences, 99-year leasehold, 439 m away, recorded 10 resales at a median of S$1,332 psf. That is one project and a single-digit-to-ten count, so it is a reference point rather than a full picture of the immediate area.
We also ran our own estimate against what actually transacted. Tested on 31 later sales at Symphony Suites as of 4Q2025, the median error was 2.5%, with 35% of sales landing inside the stated range. The error is small, but the hit rate inside the range is not high. Both numbers are worth reading together, not separately. The nearby-project table is below.
| Project | Tenure | TOP | Distance | Resales | Median psf |
|---|---|---|---|---|---|
| Nine Residences | 99-year leasehold | — | 439 m | 10 | S$1,332 psf |
In pictures
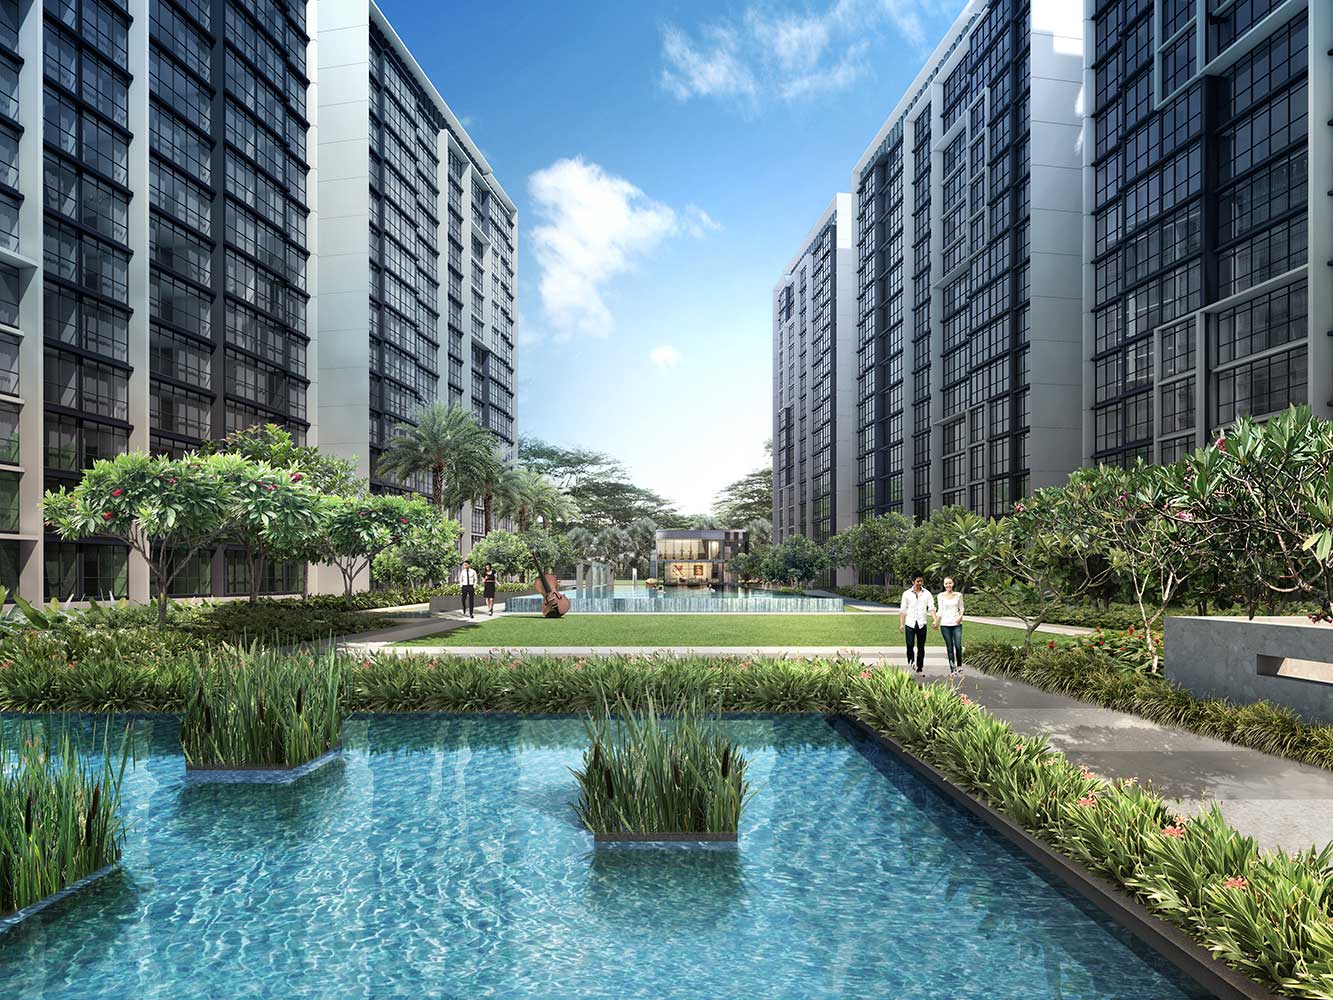
What the figures do not settle is whether the flat run since 3Q2025 holds. Three quarters of near-identical medians is a pattern, but 4Q2025 rests on 4 sales, and that thins the evidence. The next quarter's caveats will show whether the 70 to 89 sqm band keeps dominating the count, and whether the 49 rental contracts in 2Q2026 were a one-quarter step or the start of a higher level. Mix is the thing to keep watching. A shift in which size bands trade will move the project median on its own.
One median, read alone, rarely tells you much. The useful part is how it sits against the quarters before it, against the district, and against what the same project rents for. Here those three readings point in roughly the same direction, which is itself a fact about the data rather than a conclusion drawn from it.
Method: URA resale caveats at the project (developer sales and sub-sales excluded) by the quarter of the sale month. Size bands by caveated floor area. Rents are URA rental contracts at the project, and the gross yield is the mean of the quarterly median rents per square foot, annualised, over the four-quarter resale median per square foot, before any cost. Lease left is the tenure less the years since the lease started, as recorded. The estimate accuracy is this site's backtest: the engine run as of the quarter named, compared with the sales since. Private figures are from URA Data Service caveats, HDB figures from data.gov.sg resale records, both loaded weekly by this site's ingest. Medians are of the non-excluded transactions in the period named. Sales flagged by the hygiene rules (related-party transfers, bulk deals, outliers) are left out. Every figure is indicative and drawn from recorded transactions, not a formal valuation.