Norwood Grand crosses 290 units sold, or 83.3% of the project, at a median of S$2,076 psf
Published 25 Oct 2026 · Norwood Grand
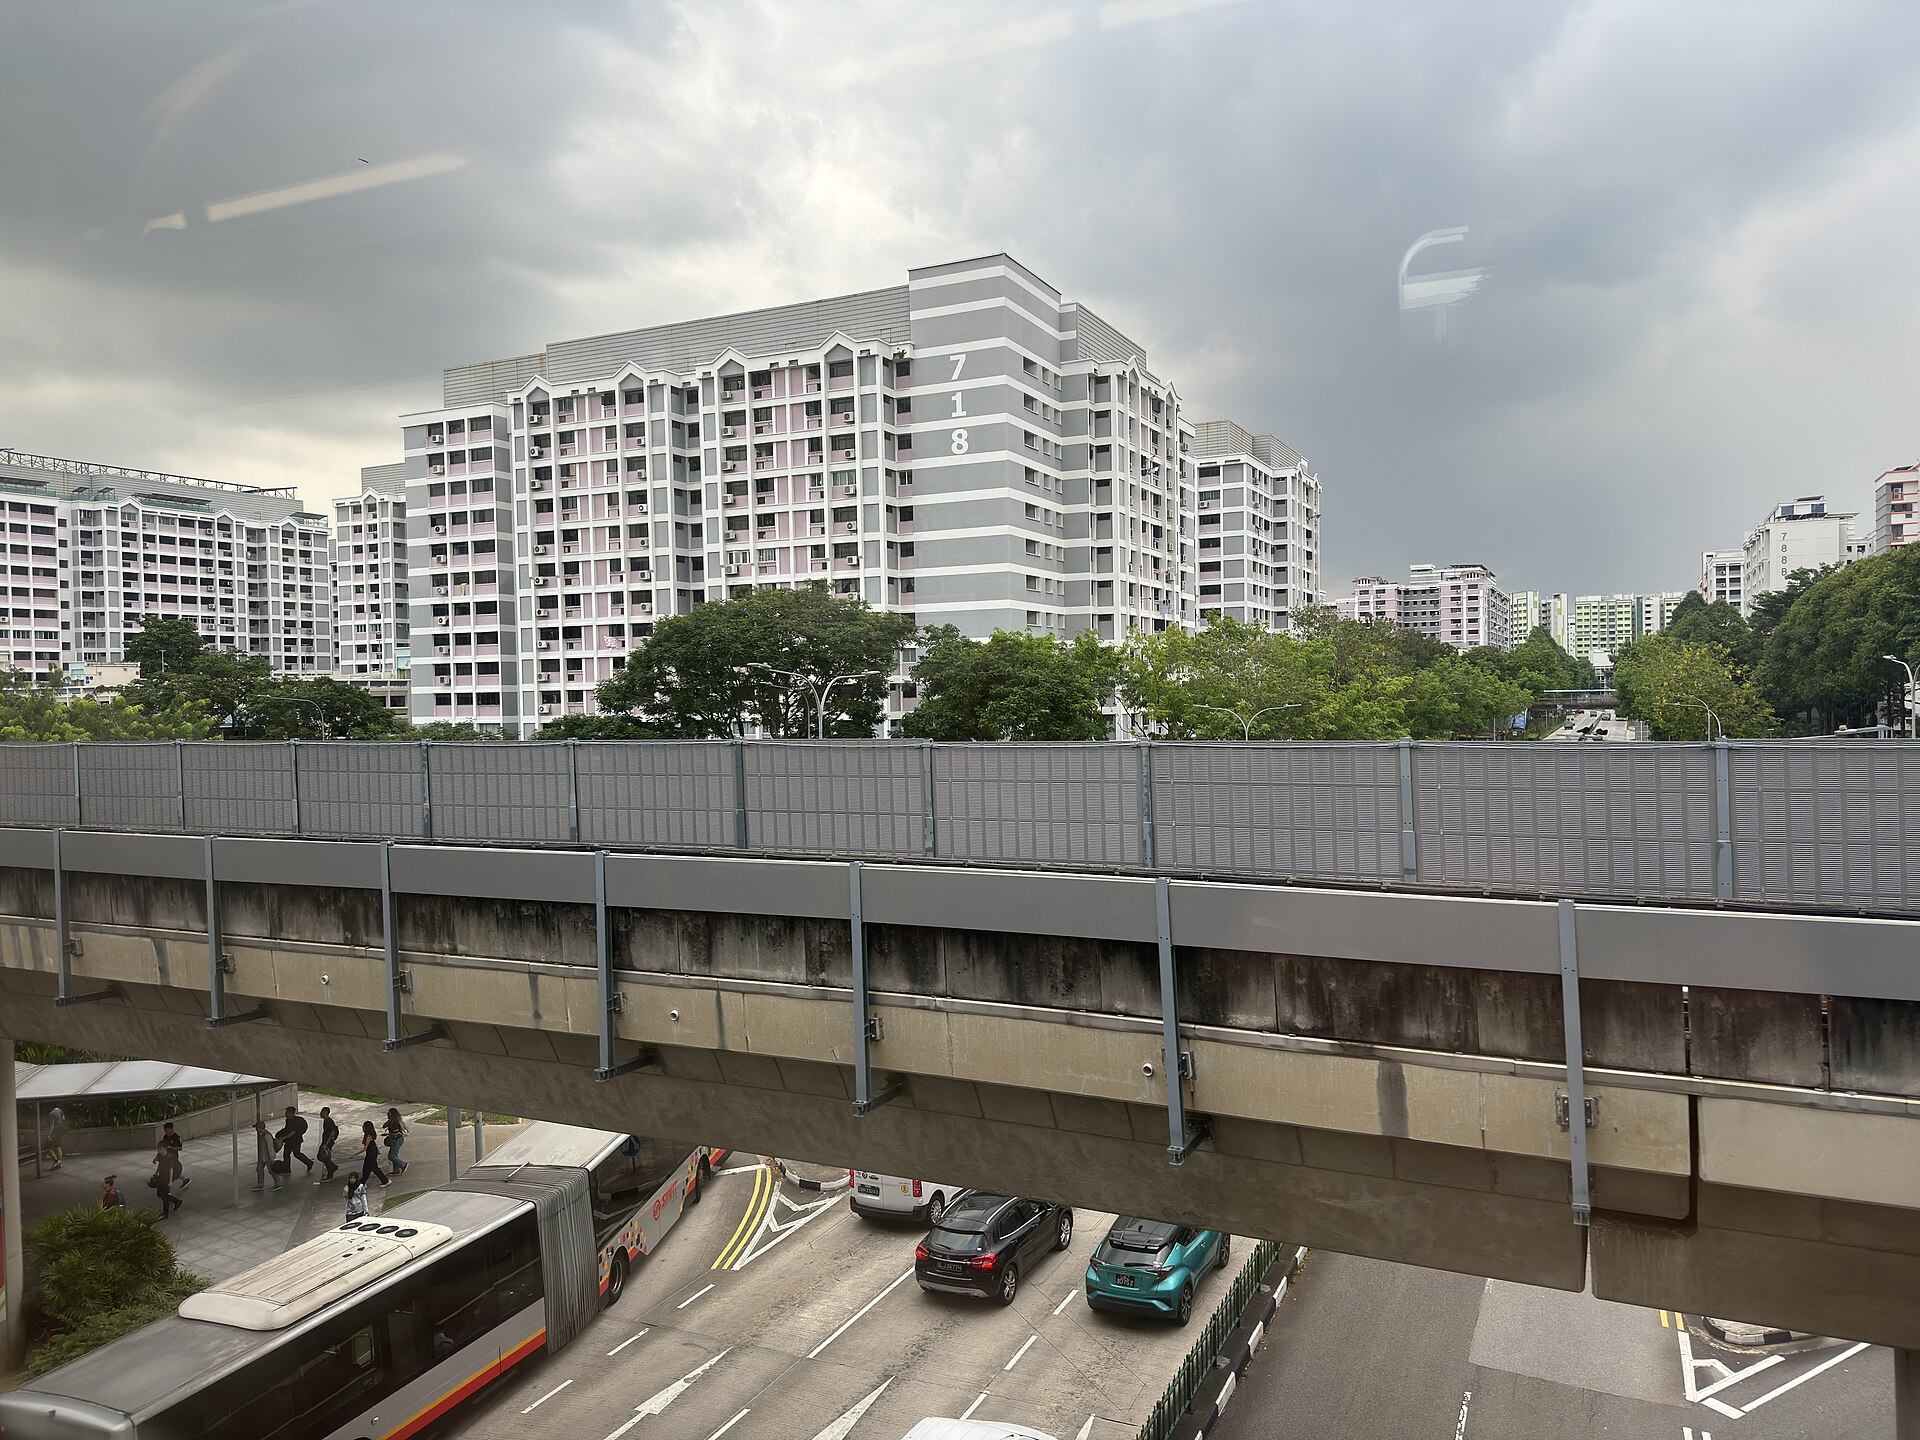
Norwood Grand has recorded 290 developer sales since October 2024. That is 83.3% of the 348-unit project, at an overall median of S$2,076 psf.
The District 25 leasehold project logged 15 sales in the three months to September 2026, based on caveats lodged with the URA Data Service. Seven of those came in September 2026 alone, at a median of S$2,083 psf.
Most sales came in the launch month
October 2024 was the busiest month, with 250 caveats. Monthly volume has since run in single digits.
The median psf has barely moved over the 17 months of selling. It was S$2,081 psf in the first month and S$2,083 psf in September 2026, a change of 0.1%.
The table and chart below set out caveats, the running total and the median psf for each month.
| Month | Caveats | Cumulative | Median psf |
|---|---|---|---|
| October 2024 | 250 | 250 | S$2,081 psf |
| November 2024 | 1 | 251 | S$1,987 psf |
| December 2024 | 1 | 252 | S$2,052 psf |
| February 2025 | 1 | 253 | S$2,061 psf |
| June 2025 | 1 | 254 | S$2,071 psf |
| July 2025 | 2 | 256 | S$2,029 psf |
| August 2025 | 3 | 259 | S$2,062 psf |
| October 2025 | 2 | 261 | S$2,087 psf |
| November 2025 | 3 | 264 | S$2,042 psf |
| February 2026 | 1 | 265 | S$2,122 psf |
| March 2026 | 2 | 267 | S$2,077 psf |
| April 2026 | 1 | 268 | S$2,032 psf |
| May 2026 | 4 | 272 | S$2,072 psf |
| June 2026 | 3 | 275 | S$2,072 psf |
| July 2026 | 4 | 279 | S$2,042 psf |
| August 2026 | 4 | 283 | S$2,063 psf |
| September 2026 | 7 | 290 | S$2,083 psf |
Units of 50 to 69 sqm were the most sold size band
The 50 to 69 sqm band accounts for 108 caveats, at a median price of S$1,370,000 and a median of S$2,117 psf. Its median area is 646 sqft.
The highest median psf sits in the smallest band. Units under 50 sqm transacted at a median of S$2,145 psf, against S$2,010 psf for the 90 to 119 sqm band.
Larger units carry the highest median prices. The 120 sqm and above band shows a median of S$2,707,000 across 56 caveats.
| Size band | Caveats | Median area | Median price | Median psf |
|---|---|---|---|---|
| under 50 sqm | 30 | 495 sqft | S$1,062,000 | S$2,145 psf |
| 50 to 69 sqm | 108 | 646 sqft | S$1,370,000 | S$2,117 psf |
| 70 to 89 sqm | 53 | 883 sqft | S$1,837,000 | S$2,071 psf |
| 90 to 119 sqm | 43 | 1,044 sqft | S$2,147,000 | S$2,010 psf |
| 120 sqm and above | 56 | 1,313 sqft | S$2,707,000 | S$2,052 psf |
Launch median is 78.1% above nearby resales
Within 1,000 m of Norwood Grand, 245 resales across eight completed projects were recorded in the 24 months to September 2026. Their median was S$1,166 psf.
The launch median of S$2,076 psf is 78.1% above that figure. All eight nearby projects are 99-year leasehold.
Parc Rosewood, 542 m away, had the most resales at 71, with a median of S$1,390 psf. Woodgrove Condominium had the lowest median, at S$1,003 psf.
| Project | Tenure | TOP | Distance | Resales | Median psf |
|---|---|---|---|---|---|
| Parc Rosewood | 99-year leasehold | — | 542 m | 71 | S$1,390 psf |
| Twin Fountains | 99-year leasehold | — | 998 m | 43 | S$1,330 psf |
| La Casa | 99-year leasehold | — | 888 m | 32 | S$1,060 psf |
| Woodhaven | 99-year leasehold | — | 847 m | 28 | S$1,354 psf |
| Casablanca | 99-year leasehold | — | 643 m | 26 | S$1,114 psf |
| Rosewood | 99-year leasehold | — | 596 m | 20 | S$1,075 psf |
| Woodgrove Condominium | 99-year leasehold | — | 898 m | 15 | S$1,003 psf |
| Rosewood Suites | 99-year leasehold | — | 583 m | 10 | S$1,045 psf |
Norwood Grand has 290 of its 348 units sold after 17 months of selling. The last three months added 15 caveats, with a median of S$2,083 psf in September 2026.
Method: URA caveats for developer sales ('new sale') at the project, dated to the month. Size bands by the caveated floor area. The nearby comparison is resale caveats in completed projects within one kilometre over 24 months, unadjusted for size, age or floor. Units sold is the caveat count, which lags option exercises by weeks. Private figures are from URA Data Service caveats, HDB figures from data.gov.sg resale records, both loaded weekly by this site's ingest. Medians are of the non-excluded transactions in the period named. Sales flagged by the hygiene rules (related-party transfers, bulk deals, outliers) are left out. Every figure is indicative and drawn from recorded transactions, not a formal valuation.