Hundred Palms Residences Crossed S$2,022 psf In 2Q2026 — But The Rent Has Not Moved All Year
Published 5 Oct 2026 · Hundred Palms Residences
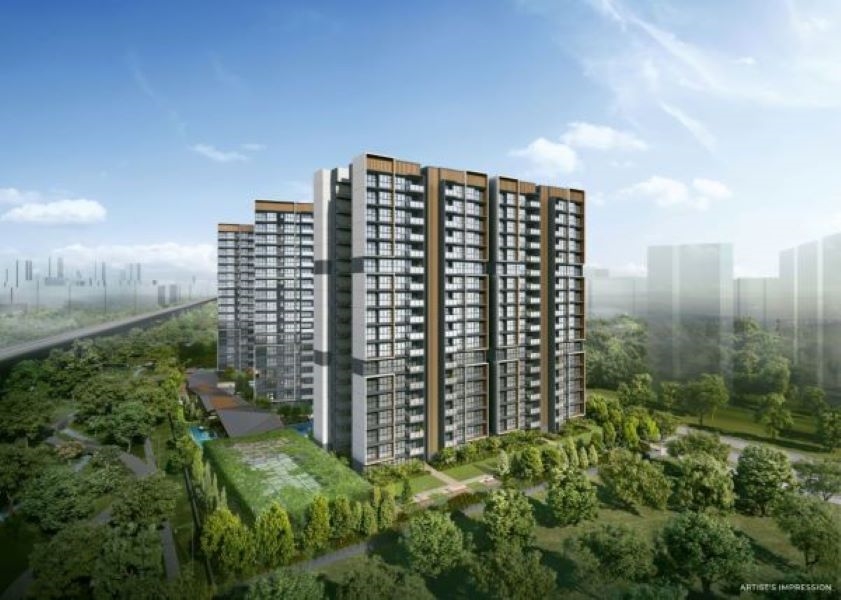
An executive condominium trading above S$2,000 psf in District 19 is the kind of figure that gets quoted on its own. We wanted to see what sits underneath it. Hundred Palms Residences has 89 years of lease left, and its resale median over the past four quarters came to S$1,903 psf. The latest quarter printed well above that. The rental table, meanwhile, looks almost unchanged from one quarter to the next. That gap between the two sides of the project is the thing worth walking through. Here is what stood out to us in the tables.
According to URA Data Service caveats, the project recorded 54 resales over 3Q2025 to 2Q2026, at a median of S$1,903 psf. Across the seven quarters we have, the quarterly median moved +8.2%. It went from S$1,869 psf in 4Q2024 to S$2,022 psf in 2Q2026. The first of those figures rests on three sales. The last rests on nine. Over the same four-quarter window, the District 19 resale median was S$1,644 psf from 2,311 sales. Hundred Palms Residences sits +15.8% against that district figure. Every number here comes from recorded caveats, not from any formal valuation.
The quarterly median has risen in every quarter since the start of 2025
The line below has one dip and then a steady climb. The low point is 1Q2025, at S$1,796 psf. From there the median rises in each of the next five quarters. It reaches S$1,945 psf in 1Q2026 and S$2,022 psf in 2Q2026. The steps in between are small. The move from 2Q2025 to 3Q2025 is S$1,858 psf to S$1,867 psf. The larger jumps come at the end of the series.
What the chart cannot settle is mix. The 1Q2025 point carries 39 sales. The last two points carry ten and nine. A quarter made up of nine transactions can shift with a couple of larger or higher-floor units. So the shape of the climb is clear, but the size of the final step rests on a thin base. That is worth holding in mind before reading the chart as a clean trend line.
The recent quarters are the thinnest in the whole table
The table below adds the sales counts and the spread around each median. The volume pattern is lopsided. 1Q2025 alone accounts for 39 resales. Volume then falls through the year: 23, then 17, then 18. The two most recent quarters record ten and nine.
The spread columns tell their own story. In 1Q2026 the quartile figures run from S$1,832 psf to S$1,983 psf. In 2Q2026 they run from S$2,004 psf to S$2,031 psf. That is a much tighter band around the median. A narrow spread on nine sales suggests the units that transacted were similar to one another. It does not tell us that the whole project would clear at that level. With counts this small, the next quarter's table will say more than this one does.
| Quarter | Resales | Median psf | 25th percentile | 75th percentile |
|---|---|---|---|---|
| Q4 2024 | 3 | S$1,869 psf | S$1,848 psf | S$1,885 psf |
| Q1 2025 | 39 | S$1,796 psf | S$1,739 psf | S$1,817 psf |
| Q2 2025 | 23 | S$1,858 psf | S$1,830 psf | S$1,919 psf |
| Q3 2025 | 17 | S$1,867 psf | S$1,820 psf | S$1,920 psf |
| Q4 2025 | 18 | S$1,898 psf | S$1,845 psf | S$1,939 psf |
| Q1 2026 | 10 | S$1,945 psf | S$1,832 psf | S$1,983 psf |
| Q2 2026 | 9 | S$2,022 psf | S$2,004 psf | S$2,031 psf |
The most traded size band is not the one with the highest psf
Splitting the 54 resales by size gives three bands. The 90 to 119 sqm band is the busiest, with 31 resales. Its median area is 1,055 sqft and its median price is S$2,045,000. That works out to a median of S$1,892 psf in the table, the lowest of the three bands.
The smaller band sits higher on a per-area basis. The 70 to 89 sqm band recorded 21 resales at a median of S$1,949 psf, on a median price of S$1,770,000. The 120 sqm and above band shows S$1,923 psf, but only two sales sit behind it. We would not read much into that row.
So the pattern points to smaller units clearing at a higher psf, with larger ones clearing at a higher absolute price. That is a common shape in resale data. It also means a project-level median psf moves with whichever sizes happened to transact.
| Size band | Resales | Median area | Median price | Median psf |
|---|---|---|---|---|
| 70 to 89 sqm | 21 | 915 sqft | S$1,770,000 | S$1,949 psf |
| 90 to 119 sqm | 31 | 1,055 sqft | S$2,045,000 | S$1,892 psf |
| 120 sqm and above | 2 | 1,426 sqft | S$2,730,000 | S$1,923 psf |
Rents have stayed flat across four quarters while the resale median climbed
The rental table is the quietest part of this profile. Contract counts run 11, 13, 8 and 11 across the four quarters. The median rent is S$4,100 a month in 3Q2025, S$4,100 in 4Q2025, S$4,200 in 1Q2026 and S$4,100 again in 2Q2026. On a per-area basis the figures sit between 4.3 and 4.5 psf a month.
Against the resale median, our engine puts the gross yield at about 2.8%. That is measured from recorded rental approvals and recorded caveats, not from any asking price. Because the rent side held steady while the resale median rose, the yield is the result of movement on one side only.
One caveat on the rental rows. Eight to thirteen contracts a quarter is a small sample. The size mix of the leased units is not shown here, and it can shift the median on its own.
| Quarter | Contracts | Median rent (S$ psf a month) | Median monthly rent |
|---|---|---|---|
| Q3 2025 | 11 | 4.4 | S$4,100 |
| Q4 2025 | 13 | 4.3 | S$4,100 |
| Q1 2026 | 8 | 4.5 | S$4,200 |
| Q2 2026 | 11 | 4.3 | S$4,100 |
Within 1 km, the range runs from S$1,188 psf to S$2,818 psf
The nearby table covers resales within 1 km over the same four quarters. The widest-traded neighbour is Affinity At Serangoon, 966 m away, with 88 resales at a median of S$1,853 psf. Terrasse, at 493 m, recorded 19 resales at S$1,572 psf. Regentville is the closest at 120 m, with 18 resales at S$1,188 psf.
At the top of the table are the two 999-year leasehold projects. Luxus Hills recorded 16 resales at a median of S$2,818 psf. Parry Park recorded six at S$2,399 psf. The two freehold entries, The Waterline and Nouvelle Park, sit lower at S$1,470 psf and S$1,346 psf, on six and four sales.
The table does not line up unit types, ages or sizes, so these are not like-for-like comparisons. Landed and non-landed stock sit in the same list. What it does show is the spread of recorded prices inside a 1 km radius, and where this project's own four-quarter median falls within it.
| Project | Tenure | TOP | Distance | Resales | Median psf |
|---|---|---|---|---|---|
| Affinity At Serangoon | 99-year leasehold | — | 966 m | 88 | S$1,853 psf |
| Terrasse | 99-year leasehold | — | 493 m | 19 | S$1,572 psf |
| Regentville | 99-year leasehold | — | 120 m | 18 | S$1,188 psf |
| Luxus Hills | 999-year leasehold | — | 875 m | 16 | S$2,818 psf |
| Parry Park | 999-year leasehold | — | 713 m | 6 | S$2,399 psf |
| Park Villas | 99-year leasehold | — | 651 m | 6 | S$1,712 psf |
| The Waterline | freehold | — | 688 m | 6 | S$1,470 psf |
| Nouvelle Park | freehold | — | 666 m | 4 | S$1,346 psf |
The highest price in the window came from one of the lowest floors
The top five resales are listed below. The largest price is S$2,760,000 in 3Q2025, for a 1,528 sqft unit in the 01-05 storey range. On a per-area basis that is S$1,806 psf, the lowest figure among the five. The unit was also the largest of the five by floor area.
Below it, a 1,324 sqft unit in the 06-10 range sold for S$2,700,000 in 2Q2026. That prints at S$2,039 psf. Two 1,270 sqft units in the 11-15 range sold at S$2,610,000 in 4Q2025 and S$2,580,000 in 2Q2026. Those work out to S$2,055 psf and S$2,031 psf.
The pattern here is simple. The biggest cheques are not the biggest psf figures. Area is doing most of the work in the price column, and storey range is doing more of it in the psf column. Five transactions is too few to call that a rule at this project.
| Quarter | Storey range | Area | Price | Per sqft |
|---|---|---|---|---|
| Q3 2025 | 01-05 | 1,528 sqft | S$2,760,000 | S$1,806 psf |
| Q2 2026 | 06-10 | 1,324 sqft | S$2,700,000 | S$2,039 psf |
| Q4 2025 | 11-15 | 1,270 sqft | S$2,610,000 | S$2,055 psf |
| Q2 2026 | 11-15 | 1,270 sqft | S$2,580,000 | S$2,031 psf |
| Q4 2025 | 01-05 | 1,270 sqft | S$2,558,888 | S$2,015 psf |
A few things stay open. The 2Q2026 median of S$2,022 psf rests on nine sales with a tight spread, so the next quarter's count will matter. The rental side has sat at S$4,100 a month in three of the four quarters shown, and any move there would change the measured yield. There is also our own accuracy to note. Tested against 44 later sales at this project as of 4Q2025, our estimate had a median error of 6.3%, and 27% of those sales landed inside the stated range. That is a reminder that a modelled figure and a recorded caveat are not the same thing.
We keep coming back to the same point with project profiles like this one. A single headline median, taken alone, rarely carries enough context to mean much. The useful part is how it sits against the quarters before it, the size bands behind it, the rents next to it, and the projects down the road. Read together, the tables here describe a rising resale median on falling volume, with the rental line holding still. Whether that pairing persists is a question only the next quarter of data can answer.
Method: URA resale caveats at the project (developer sales and sub-sales excluded) by the quarter of the sale month. Size bands by caveated floor area. Rents are URA rental contracts at the project, and the gross yield is the mean of the quarterly median rents per square foot, annualised, over the four-quarter resale median per square foot, before any cost. Lease left is the tenure less the years since the lease started, as recorded. The estimate accuracy is this site's backtest: the engine run as of the quarter named, compared with the sales since. Private figures are from URA Data Service caveats, HDB figures from data.gov.sg resale records, both loaded weekly by this site's ingest. Medians are of the non-excluded transactions in the period named. Sales flagged by the hygiene rules (related-party transfers, bulk deals, outliers) are left out. Every figure is indicative and drawn from recorded transactions, not a formal valuation.