20 District 25 Resales Closed At Or Under $1,200,000 In 2Q2026 — The Largest Was A 1,292 Sqft EC At Northoaks
Published 5 Nov 2026
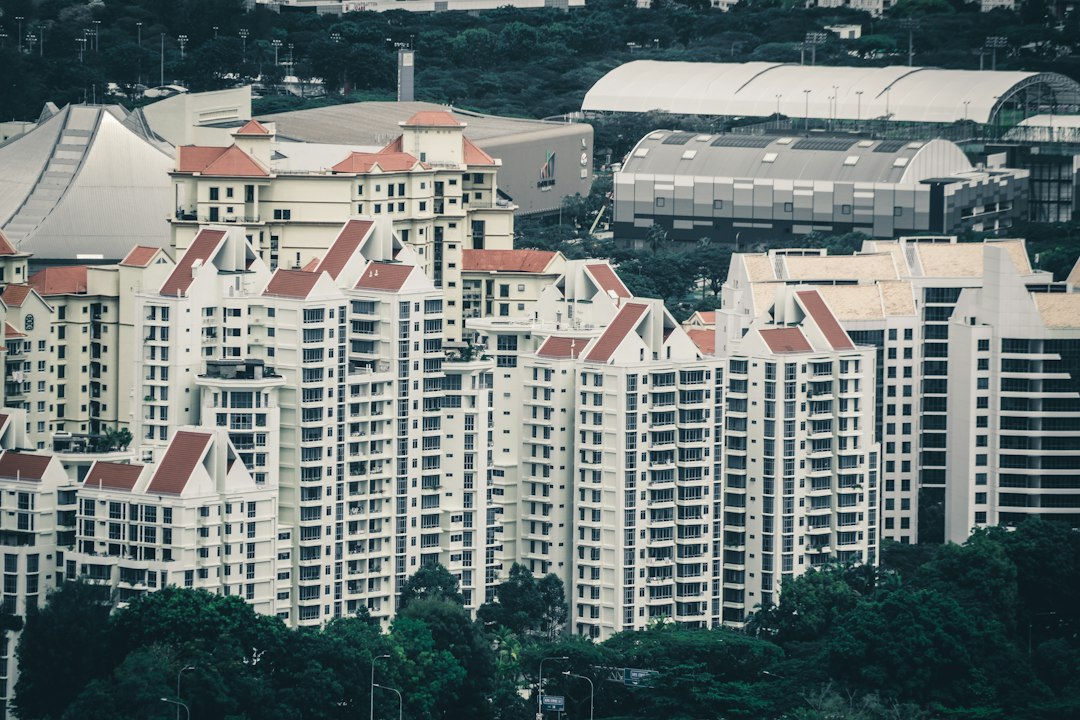
A fixed budget does not buy the same thing in every project. In District 25, which covers Woodlands and Kranji, the resales at or under $1,200,000 in 2Q2026 included large EC units and much smaller condo units, at quite different psf levels.
According to URA Data Service caveats, District 25 recorded 79 private resales in 2Q2026. Of these, 20 (25.3%) were at or under $1,200,000, spread across 10 projects. The median for that group was $1,189 psf. The district's median was $1,262 psf, which puts the group at -5.8% against it. The district's median resale price was $1,380,000. This piece is a record of what sold, not a list of what is for sale. Every figure is indicative and comes from recorded transactions, not a formal valuation of any home.
Resales at or under the budget sat at a lower median psf than the district as a whole
We started with how the budget line was drawn. It comes from the data. We took the 40th percentile of the quarter's resale prices and rounded it down to $100,000. The district's median resale price was $1,380,000, so the line sits below the middle of the market. The group under it is 20 resales out of 79, or 25.3%. Those 20 changed hands in 10 projects, so this is not one development's story. It is a spread, though not a wide one, and a few projects show up more than once in the tables that follow.
The more telling comparison is on psf. The group's median was $1,189 psf, against $1,262 psf for the district, or -5.8%. That points to the under-budget group trading at a lower psf level overall, but it does not say why. The group mixes unit types, sizes and storey ranges. A lower psf here could reflect what was in the group as much as how any one project priced. The next two sections rank the same set two ways, first by size and then by psf. Each table shows the top of its ranking.
The largest units under the budget were mostly ECs, with Northoaks at the top of the size ranking
Ranked by size, the top row is a 1,292 sqft EC at Northoaks on the 01-05 storey range. It sold in Jun 2026 for $1,100,000, or $852 psf. A second Northoaks unit follows at 1,249 sqft on the 11-15 range for $1,190,000 ($953 psf), also in Jun 2026. Woodsvale comes next with 1,227 sqft for $1,200,000 ($978 psf) in Apr 2026. A third Northoaks resale, at 1,216 sqft, went for $1,115,000 ($917 psf) in May 2026. All four are ECs on 99-year leasehold. The TOP column reads as a dash on every row, so this table gives no completion year.
Lower down, the mix widens. La Casa appears twice at 1,141 sqft on the 01-05 range. One sold for $1,170,000 ($1,025 psf) in Apr 2026, and the other in Jun 2026 at $1,052 psf. The Woodgrove, listed as an apartment, sold 1,033 sqft for $968,000 ($937 psf). Rosewood, a condo, sold 1,012 sqft for $1,060,000 ($1,048 psf). Northwave closes the list with two 980 sqft ECs at $1,192,000 ($1,217 psf) and $1,195,000 ($1,220 psf). As size falls down this table, the psf figures mostly rise. That suggests that, within this group, the smaller units printed higher psf prices. With so few rows, we would not read it as a rule.
| Project | Type | Tenure | TOP | Area | Storey range | Price | Per sqft | Month |
|---|---|---|---|---|---|---|---|---|
| Northoaks | ec | 99-year leasehold | — | 1,292 sqft | 01-05 | S$1,100,000 | S$852 psf | Jun 2026 |
| Northoaks | ec | 99-year leasehold | — | 1,249 sqft | 11-15 | S$1,190,000 | S$953 psf | Jun 2026 |
| Woodsvale | ec | 99-year leasehold | — | 1,227 sqft | 06-10 | S$1,200,000 | S$978 psf | Apr 2026 |
| Northoaks | ec | 99-year leasehold | — | 1,216 sqft | 11-15 | S$1,115,000 | S$917 psf | May 2026 |
| La Casa | ec | 99-year leasehold | — | 1,141 sqft | 01-05 | S$1,170,000 | S$1,025 psf | Apr 2026 |
| La Casa | ec | 99-year leasehold | — | 1,141 sqft | 01-05 | S$1,200,000 | S$1,052 psf | Jun 2026 |
| The Woodgrove | apartment | 99-year leasehold | — | 1,033 sqft | 06-10 | S$968,000 | S$937 psf | Apr 2026 |
| Rosewood | condo | 99-year leasehold | — | 1,012 sqft | 01-05 | S$1,060,000 | S$1,048 psf | Jun 2026 |
| Northwave | ec | 99-year leasehold | — | 980 sqft | 01-05 | S$1,192,000 | S$1,217 psf | Apr 2026 |
| Northwave | ec | 99-year leasehold | — | 980 sqft | 01-05 | S$1,195,000 | S$1,220 psf | Jun 2026 |
Ranked by psf, Northoaks fills the lowest rungs and the smaller condos sit at the other end of the table
The psf ranking opens with the same unit that topped the size table: the 1,292 sqft Northoaks EC at $852 psf, which sold for $1,100,000 in Jun 2026. Next is another Northoaks resale at $917 psf. Then comes The Woodgrove apartment at $937 psf, on 1,033 sqft in Apr 2026. The 1,249 sqft Northoaks unit at $953 psf and the Woodsvale unit at $978 psf follow. La Casa's Apr 2026 resale is next at $1,025 psf. Every project in this stretch of the table is 99-year leasehold, and the TOP column is again blank.
The other end of the table is smaller and mostly condo. Rosewood's 1,012 sqft unit shows $1,048 psf, and La Casa's Jun 2026 resale shows $1,052 psf. Casablanca, a condo, sold 893 sqft on the 11-15 range for $996,000, or $1,115 psf, in Apr 2026. The last row is Parc Rosewood: 775 sqft for $900,000, or $1,161 psf, also in Apr 2026. Every row here prints below the group's median psf, and below the district's too. The Northwave resales at $1,217 psf and $1,220 psf do not appear, which tells us they rank higher than anything printed in this table.
| Project | Type | Tenure | TOP | Area | Storey range | Price | Per sqft | Month |
|---|---|---|---|---|---|---|---|---|
| Northoaks | ec | 99-year leasehold | — | 1,292 sqft | 01-05 | S$1,100,000 | S$852 psf | Jun 2026 |
| Northoaks | ec | 99-year leasehold | — | 1,216 sqft | 11-15 | S$1,115,000 | S$917 psf | May 2026 |
| The Woodgrove | apartment | 99-year leasehold | — | 1,033 sqft | 06-10 | S$968,000 | S$937 psf | Apr 2026 |
| Northoaks | ec | 99-year leasehold | — | 1,249 sqft | 11-15 | S$1,190,000 | S$953 psf | Jun 2026 |
| Woodsvale | ec | 99-year leasehold | — | 1,227 sqft | 06-10 | S$1,200,000 | S$978 psf | Apr 2026 |
| La Casa | ec | 99-year leasehold | — | 1,141 sqft | 01-05 | S$1,170,000 | S$1,025 psf | Apr 2026 |
| Rosewood | condo | 99-year leasehold | — | 1,012 sqft | 01-05 | S$1,060,000 | S$1,048 psf | Jun 2026 |
| La Casa | ec | 99-year leasehold | — | 1,141 sqft | 01-05 | S$1,200,000 | S$1,052 psf | Jun 2026 |
| Casablanca | condo | 99-year leasehold | — | 893 sqft | 11-15 | S$996,000 | S$1,115 psf | Apr 2026 |
| Parc Rosewood | condo | 99-year leasehold | — | 775 sqft | 01-05 | S$900,000 | S$1,161 psf | Apr 2026 |
The tables record what sold, and they cannot settle how much of the psf gap comes from the mix of units
A few things limit how far these tables can be pushed. The group is small, so one or two resales can move a median. It mixes ECs, condos and apartments, and each type has its own pattern of size and storey. Storey ranges are bands, not exact floors. The TOP column is blank across the rows, so we cannot sort by age. The resales also fall across Apr 2026, May 2026 and Jun 2026, and the tables do not adjust for month. The lower median psf for the group is therefore a description of what traded. It is not a finding about any one project.
Each row is a recorded transaction, as filed in URA Data Service caveats. It shows the price a unit changed hands at, not what any home is worth. The rows also say nothing about what is for sale now. Two units of the same size in the same project can print different psf figures a few months apart, as the La Casa and Northwave rows show. Each row is one data point on one date.
What the figures leave open is whether this pattern holds. In the 3Q2026 data, we will look at the share of resales at or under the budget line, the group's median psf against the district's, and which projects appear. The line is set from each quarter's prices, so it can move too. A thin quarter would also make any comparison less firm.
One quarter's list is a snapshot, and a single headline is rarely enough on its own. The value lies in how it fits the wider direction of the market, quarter after quarter. We will keep recording what sold, and let the longer run of figures give the context.
Method: resale caveats (developer sales and sub-sales excluded) in the district and quarter named with a price at or under the budget, single-unit caveats only. Ranked by caveated floor area and by price per square foot. These are recorded sales, not listings, and say nothing about what is available or what a unit would fetch now. Private figures are from URA Data Service caveats, HDB figures from data.gov.sg resale records, both loaded weekly by this site's ingest. Medians are of the non-excluded transactions in the period named. Sales flagged by the hygiene rules (related-party transfers, bulk deals, outliers) are left out. Every figure is indicative and drawn from recorded transactions, not a formal valuation.