D'Leedon's Resale Median Is Up Just 1.0% Over Eight Quarters — And Sits 7.8% Below Its District
Published 16 Nov 2026 · D'Leedon
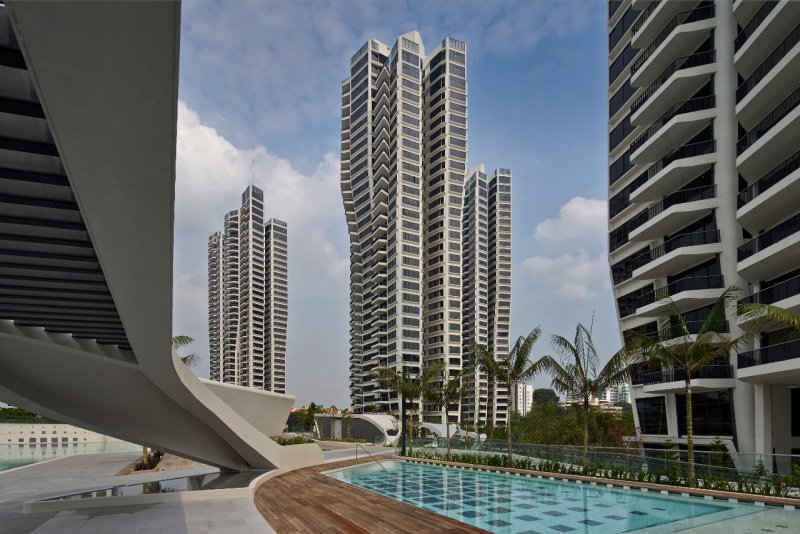
D'Leedon's resale prices have barely shifted over two years. Yet the project trades well below its freehold neighbours and below its district as a whole.
According to URA Data Service caveats, D'Leedon recorded 71 resales over 4Q2025 to 3Q2026 at a median of $2,080 psf. It is a 99-year leasehold condo in District 10, with 83 years of lease left. Across the eight quarters shown, the quarterly resale median moved +1.0%, from $2,044 psf in 4Q2024 to $2,065 psf in 3Q2026. Over the same four quarters, the district's resale median was $2,255 psf from 947 sales, and D'Leedon sits -7.8% against it. Our own engine puts the gross yield at about 3.2%, using URA rental contracts and the resale median. We looked at the quarterly record, the size bands, rents, neighbours and the highest prices. Here's what stood out to us.
The quarterly median has stayed inside a small range for eight quarters
We started with the quarterly record. The median opened the series at $2,044 psf in 4Q2024 and closed it at $2,065 psf in 3Q2026. In between, it reached $2,096 psf in 3Q2025 and a high of $2,106 psf in 1Q2026. It then eased to $2,084 psf in 2Q2026. The line in the chart below is fairly flat. The overall move across the eight quarters was +1.0%. The spread between the 25th and 75th percentiles changes from quarter to quarter. In 2Q2026 the two sat at $1,997 psf and $2,205 psf. In 1Q2025 they sat at $2,037 psf and $2,099 psf.
Sales counts matter here. 2Q2025 had 9 resales, while 2Q2026 had 21 and 4Q2025 had 20. A median drawn from 9 or 11 sales can move with the mix of units that happened to trade, not only with the price level. So the small moves between quarters suggest little on their own. What the eight quarters do show is a median that stayed within one band, with the latest reading only a little above the first. The table and chart below carry every quarter, with the sales count for each.
| Quarter | Resales | Median psf | 25th percentile | 75th percentile |
|---|---|---|---|---|
| Q4 2024 | 11 | S$2,044 psf | S$1,960 psf | S$2,090 psf |
| Q1 2025 | 18 | S$2,047 psf | S$2,037 psf | S$2,099 psf |
| Q2 2025 | 9 | S$2,056 psf | S$1,988 psf | S$2,105 psf |
| Q3 2025 | 14 | S$2,096 psf | S$2,063 psf | S$2,135 psf |
| Q4 2025 | 20 | S$2,063 psf | S$2,017 psf | S$2,162 psf |
| Q1 2026 | 17 | S$2,106 psf | S$2,028 psf | S$2,155 psf |
| Q2 2026 | 21 | S$2,084 psf | S$1,997 psf | S$2,205 psf |
| Q3 2026 | 13 | S$2,065 psf | S$2,018 psf | S$2,154 psf |
Units of 120 sqm and above were the most traded size, with 90 to 119 sqm close behind
Units of 120 sqm and above were the most traded size in the window. There were 29 resales at a median of $3,250,000 ($2,136 psf), with a median area of 1,582 sqft. The 90 to 119 sqm band came close behind, with 28 resales at a median of $2,334,000 ($2,049 psf) and a median area of 1,076 sqft. The two larger bands are the busiest rows in the table below. Their price per square foot differs by a modest amount, even though the median prices sit far apart.
The smaller bands trade less often. The 50 to 69 sqm band had 9 resales at a median of $1,288,000, with a median area of 635 sqft and $2,000 psf. The 70 to 89 sqm band had 5 resales at a median of $1,700,000, with a median area of 786 sqft and $2,164 psf. That is the highest median psf of the four bands, but it rests on five sales. One unusual sale can move a median built on so few. The gaps between bands per square foot look modest, and they rest on small counts in places.
| Size band | Resales | Median area | Median price | Median psf |
|---|---|---|---|---|
| 50 to 69 sqm | 9 | 635 sqft | S$1,288,000 | S$2,000 psf |
| 70 to 89 sqm | 5 | 786 sqft | S$1,700,000 | S$2,164 psf |
| 90 to 119 sqm | 28 | 1,076 sqft | S$2,334,000 | S$2,049 psf |
| 120 sqm and above | 29 | 1,582 sqft | S$3,250,000 | S$2,136 psf |
Rents per square foot edged up while the median monthly rent came down
Rental contracts at D'Leedon rose from 179 in 4Q2025 to 245 in 3Q2026, with 156 in 1Q2026 and 205 in 2Q2026 along the way. The median rent per square foot moved from $5.4 to $5.5, then $5.7 and then $5.6 a month. The median monthly rent went the other way. It was $6,200 in 4Q2025, then $5,950, $5,650 and $5,700. The table below sets the two series side by side, quarter by quarter, using URA rental contracts.
The two measures do not have to move together. One is rent per area. The other is the rent on whichever units were let in that quarter. The data cannot settle whether a change in the mix of let units sits behind the gap. In 3Q2026 there were 245 contracts at a median of $5.63 psf a month, with a median rent of $5,700. Against the resale median, our engine puts the gross yield at about 3.2%. That figure is indicative and rests on recorded contracts and recorded sales.
| Quarter | Contracts | Median rent (S$ psf a month) | Median monthly rent |
|---|---|---|---|
| Q4 2025 | 179 | 5.4 | S$6,200 |
| Q1 2026 | 156 | 5.5 | S$5,950 |
| Q2 2026 | 205 | 5.7 | S$5,650 |
| Q3 2026 | 245 | 5.6 | S$5,700 |
Freehold neighbours within 1 km trade well above D'Leedon, while the leasehold ones sit nearer to it
We then looked at resales within 1 km of D'Leedon. The two Leedon freehold projects sit furthest above. Leedon Residence, 437 m away, had 15 resales at a median of $2,866 psf. Leedon Green, 445 m away, had 13 at $2,781 psf. Other freehold names sit lower: Sommerville Park at $2,217 psf, Parvis at $2,245 psf and the landed homes on Coronation Road West at $2,200 psf. Freehold neighbours do not all price alike. Resale counts in the table below run from 6 to 15 a project, so each median is a thin sample.
Leasehold neighbours sit closer to D'Leedon's $2,080 psf. Duchess Crest, a 99-year leasehold, had 12 resales at $1,960 psf. The Merasaga, also 99-year, had 7 at $2,028 psf. Duchess Residences, a 999-year leasehold, had 6 at $2,112 psf. The table gives no completion year for these projects, so age cannot be compared here. The wider picture is the district median of $2,255 psf from 947 sales, which is above D'Leedon and above most of the leasehold rows. Tenure and location both show up in the table, and the data does not separate them.
| Project | Tenure | TOP | Distance | Resales | Median psf |
|---|---|---|---|---|---|
| Leedon Residence | freehold | — | 437 m | 15 | S$2,866 psf |
| Leedon Green | freehold | — | 445 m | 13 | S$2,781 psf |
| Duchess Crest | 99-year leasehold | — | 948 m | 12 | S$1,960 psf |
| Sommerville Park | freehold | — | 561 m | 9 | S$2,217 psf |
| The Merasaga | 99-year leasehold | — | 982 m | 7 | S$2,028 psf |
| Parvis | freehold | — | 881 m | 7 | S$2,245 psf |
| Landed, Coronation Road West | freehold | — | 967 m | 6 | S$2,200 psf |
| Duchess Residences | 999-year leasehold | — | 923 m | 6 | S$2,112 psf |
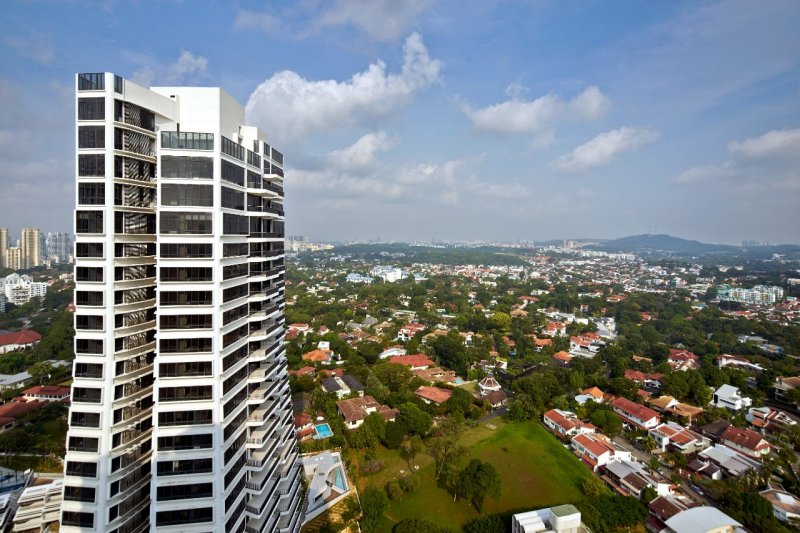
The highest resale hit $4.8M, and our estimate fell inside its stated range for 37% of later sales
The highest resale price in the window was $4,800,000 in 2Q2026, for a 2,433 sqft unit on the 26-30 storey range, at $1,973 psf. That psf sits below the window's median of $2,080 psf. The five highest sales are all large units, from 2,024 sqft to 2,433 sqft. Three are on the 26-30 range. The highest psf among the five was $2,106 psf, for a $4,375,000 sale in 1Q2026 on the 21-25 range. Large units lift the price, and the table below shows that price and price per square foot do not rank the sales in the same order.
We also tested this site's estimate at D'Leedon. As of 1Q2026, it was checked against 54 later sales. The median error was 3.8%, and 37% of sales landed inside the stated range. The remaining sales fell outside it. The estimate is indicative and built from recorded transactions. The figures above show how it has performed at this one project, over a sample of 54 sales.
| Quarter | Storey range | Area | Price | Per sqft |
|---|---|---|---|---|
| Q2 2026 | 26-30 | 2,433 sqft | S$4,800,000 | S$1,973 psf |
| Q1 2026 | 21-25 | 2,077 sqft | S$4,375,000 | S$2,106 psf |
| Q4 2025 | 26-30 | 2,271 sqft | S$4,300,000 | S$1,893 psf |
| Q4 2025 | 26-30 | 2,228 sqft | S$4,280,000 | S$1,921 psf |
| Q2 2026 | 11-15 | 2,024 sqft | S$4,100,000 | S$2,026 psf |
The figures leave open whether the narrow band holds. Several quarters rest on small counts, and the 70 to 89 sqm band rests on only five sales. In the 4Q2026 data, we will watch where the quarterly median lands against the band it has kept so far. We will also watch how many resales are recorded, how rental contracts compare with the latest quarter, and how the freehold neighbours' medians move.
A single headline is rarely enough on its own. A +1.0% move or a -7.8% gap says little until it sits next to the sales counts, the size mix and the neighbours. The value lies in how a project's numbers fit the broader direction of the market. We will keep adding each quarter's data to the record.
Method: URA resale caveats at the project (developer sales and sub-sales excluded) by the quarter of the sale month. Size bands by caveated floor area. Rents are URA rental contracts at the project, and the gross yield is the mean of the quarterly median rents per square foot, annualised, over the four-quarter resale median per square foot, before any cost. Lease left is the tenure less the years since the lease started, as recorded. The estimate accuracy is this site's backtest: the engine run as of the quarter named, compared with the sales since. Private figures are from URA Data Service caveats, HDB figures from data.gov.sg resale records, both loaded weekly by this site's ingest. Medians are of the non-excluded transactions in the period named. Sales flagged by the hygiene rules (related-party transfers, bulk deals, outliers) are left out. Every figure is indicative and drawn from recorded transactions, not a formal valuation. Facilities, layouts and photographs, where shown, are as supplied by the developer or seen on our own visit, and are not engine data.