Choa Chu Kang HDB Resales In Q2 2026: Median S$5,588 psm From 246 Sales, +0.9% On The Year
Published 18 Oct 2026
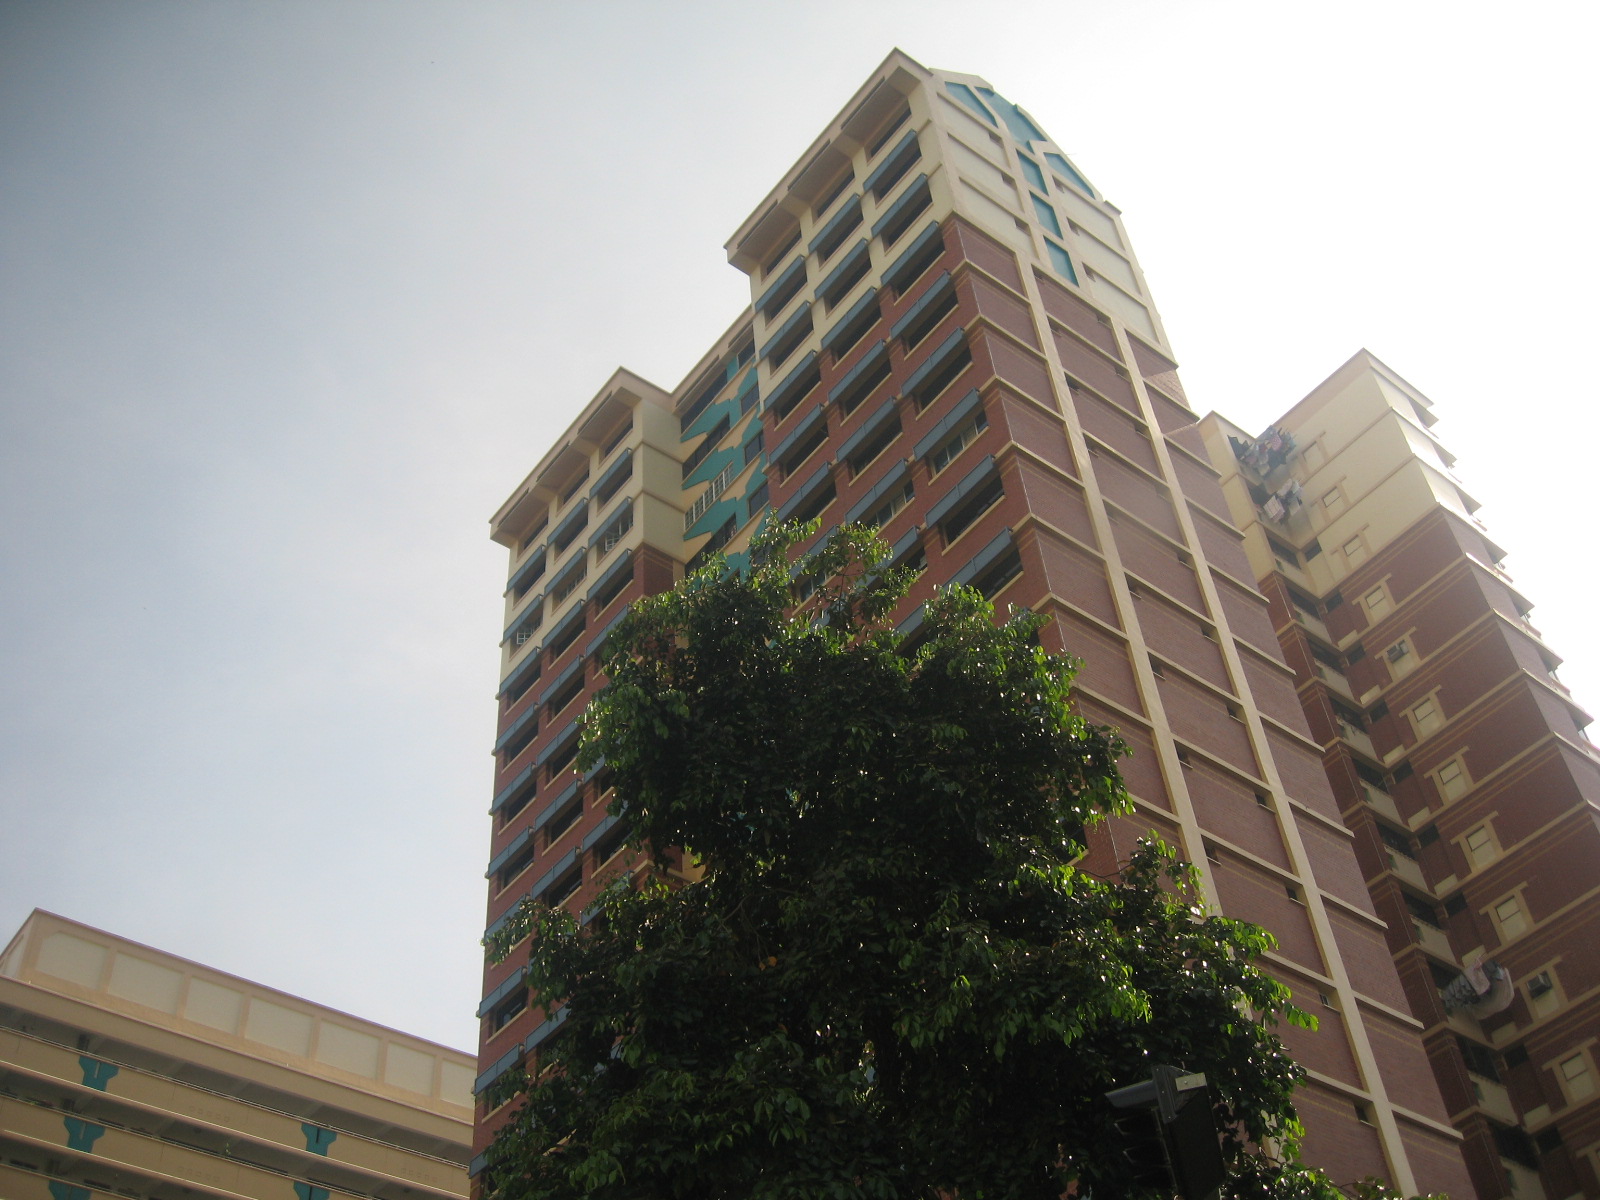
If you own a flat in Choa Chu Kang, or you are watching the town, the headline number moves every quarter. Median price and median psm can also move in different directions, which is what happened here.
In this article, we look at eight quarters of Choa Chu Kang resale medians, the flat-type breakdown against a year earlier, and the quarter's highest-priced sales.
Choa Chu Kang recorded 246 HDB resales in Q2 2026. The median was S$5,588 psm and the median price was S$586,500. That is +0.9% on psm and -3.5% on price against Q2 2025, based on HDB resale data from data.gov.sg.
How Have Prices Moved Over The Past Eight Quarters?
The table and chart below track the town's median psm, median price and sales count from Q3 2024.
The town's median psm has moved +5.4% since Q3 2024. It started at S$5,300 psm on 345 sales. Note that the median price line is less steady. It peaked at S$608,000 in Q2 2025 and sat at S$586,500 in Q2 2026.
Sales volume also swings. The lowest count in the run was 186 in Q4 2025. Island-wide, the HDB resale median psm moved -0.4% over the year to Q2 2026.
| Quarter | Median psm | Median price | Sales | At S$1m or more |
|---|---|---|---|---|
| Q3 2024 | S$5,300 psm | S$565,000 | 345 | 0 |
| Q4 2024 | S$5,486 psm | S$570,000 | 260 | 0 |
| Q1 2025 | S$5,430 psm | S$586,944 | 250 | 0 |
| Q2 2025 | S$5,536 psm | S$608,000 | 275 | 0 |
| Q3 2025 | S$5,608 psm | S$590,000 | 293 | 0 |
| Q4 2025 | S$5,548 psm | S$600,000 | 186 | 0 |
| Q1 2026 | S$5,579 psm | S$602,000 | 253 | 0 |
| Q2 2026 | S$5,588 psm | S$586,500 | 246 | 0 |
Which Flat Types Moved Most?
Town-level medians mix all flat types together. The table below splits Q2 2026 by type and sets each against Q2 2025.
The table shows 4-room flats at a median of S$560,888 on 135 sales, down 1.4% on the year. The 5-room median was S$662,000 on 75 sales, down 1.2%. Executive flats came in at S$830,000 on 15 sales, up 0.7%.
The two smaller types moved further. The 2-room median was S$430,000, up 23.6%, but on just five sales. The 3-room median was S$429,000, down 10.6% on 16 sales. With counts that small, a change in which flats sold can move the median on its own.
| Flat type | Median price Q2 2026 | Median psm | Sales | Median price Q2 2025 | Change |
|---|---|---|---|---|---|
| Choa Chu Kang 2-room | S$430,000 | S$9,149 psm | 5 | S$348,000 | +23.6% |
| Choa Chu Kang 3-room | S$429,000 | S$5,877 psm | 16 | S$480,000 | -10.6% |
| Choa Chu Kang 4-room | S$560,888 | S$5,549 psm | 135 | S$569,000 | -1.4% |
| Choa Chu Kang 5-room | S$662,000 | S$5,455 psm | 75 | S$670,000 | -1.2% |
| Choa Chu Kang executive | S$830,000 | S$5,685 psm | 15 | S$824,444 | +0.7% |
The Quarter's Highest Prices In Choa Chu Kang
No resale in Choa Chu Kang reached S$1 million in Q2 2026. The same was true in Q2 2025. The table below lists the five highest recorded prices for the quarter.
The top sale was S$950,000 for an executive flat at Blk 640 Choa Chu Kang St 64. The unit was 145 sqm on the 13 to 15 storey range, at S$6,552 psm, with 71 years of lease left.
All five of the quarter's highest sales were executive flats of 145 sqm or larger. Two were at Teck Whye Lane, each with 62 years of lease left. These are recorded transaction prices, not valuations.
| Block | Flat type | Storey range | Area | Price | Per sqm | Lease left (years) |
|---|---|---|---|---|---|---|
| Blk 640 Choa Chu Kang St 64 | executive | 13 TO 15 | 145 sqm | S$950,000 | S$6,552 psm | 71 |
| Blk 108 Teck Whye Lane | executive | 07 TO 09 | 146 sqm | S$922,888 | S$6,321 psm | 62 |
| Blk 120 Teck Whye Lane | executive | 10 TO 12 | 146 sqm | S$875,000 | S$5,993 psm | 62 |
| Blk 273 Choa Chu Kang Ave 2 | executive | 07 TO 09 | 148 sqm | S$870,000 | S$5,878 psm | 66 |
| Blk 282 Choa Chu Kang Ave 3 | executive | 10 TO 12 | 152 sqm | S$865,000 | S$5,691 psm | 65 |
Key Takeaways
Choa Chu Kang logged 246 resales in Q2 2026 at a median of S$5,588 psm, up 0.9% on the year, while the median price of S$586,500 was down 3.5%. The island-wide median psm moved -0.4% over the same year. No flat in the town sold at S$1 million or more in either quarter.
These figures come from recorded HDB resale transactions on data.gov.sg. They describe what changed hands in the quarter, so the mix of flat types, storeys and remaining lease affects each median. They are indicative only, and they are not a valuation of any individual flat.
Method: HDB resale records grouped by town and by the quarter of the sale month. Medians are of price and of price per square metre. Flat types with fewer than five sales in the quarter are omitted from the breakdown. Lease left is rounded to whole years as at the sale. Private figures are from URA Data Service caveats, HDB figures from data.gov.sg resale records, both loaded weekly by this site's ingest. Medians are of the non-excluded transactions in the period named. Sales flagged by the hygiene rules (related-party transfers, bulk deals, outliers) are left out. Every figure is indicative and drawn from recorded transactions, not a formal valuation.