Bellewaters Resale Medians Climbed 14.3% Over Eight Quarters — Yet It Still Sits 6.7% Below Its Own District
Published 14 Oct 2026 · Bellewaters
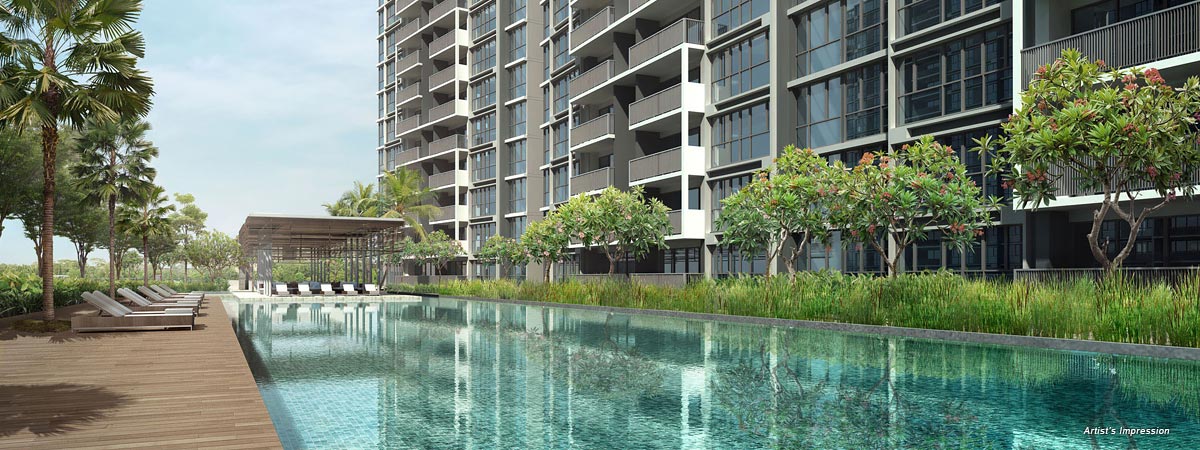
An executive condo that keeps setting fresh quarterly highs, but still prices under the district it sits in. That is the tension in the Bellewaters numbers this quarter, and it is worth sitting with for a moment.
According to URA Data Service caveats, Bellewaters recorded 40 resales over the four quarters from 3Q2025 to 2Q2026, at a median of S$1,534 psf. Across the eight quarters shown, the quarterly resale median moved +14.3%, from S$1,380 psf in 3Q2024 on 7 sales to S$1,578 psf in 2Q2026 on 11 sales. Over the same four-quarter window, the District 19 resale median was S$1,644 psf from 2,311 sales, which puts Bellewaters at -6.7% against it. The project is a 99-year EC in District 19, with 86 years of lease left.
The quarterly median has risen in six of the eight quarters we looked at
The run is fairly steady rather than spiky. From S$1,380 psf in 3Q2024, the median moved to S$1,388 psf in 4Q2024, then S$1,473 psf in 1Q2025 and S$1,481 psf in 2Q2025. The second half of 2025 carried on in the same direction, with S$1,504 psf in 3Q2025 and S$1,548 psf in 4Q2025. The only step back came in 1Q2026, at S$1,529 psf on 7 sales, before 2Q2026 printed S$1,578 psf.
What stands out to us is the spread, not just the midpoint. In 3Q2024 the quartiles sat at S$1,350 psf and S$1,433 psf. By 2Q2026 they were S$1,564 psf and S$1,624 psf. The whole band has shifted up, not just the median line.
One caution. Quarterly counts here run from 6 to 18 transactions. At those volumes, a few large or small stacks can move a median, and the table cannot separate that from a genuine repricing. The 1Q2026 dip sat on just 7 sales.
| Quarter | Resales | Median psf | 25th percentile | 75th percentile |
|---|---|---|---|---|
| Q3 2024 | 7 | S$1,380 psf | S$1,350 psf | S$1,433 psf |
| Q4 2024 | 14 | S$1,388 psf | S$1,370 psf | S$1,460 psf |
| Q1 2025 | 6 | S$1,473 psf | S$1,394 psf | S$1,479 psf |
| Q2 2025 | 18 | S$1,481 psf | S$1,453 psf | S$1,523 psf |
| Q3 2025 | 13 | S$1,504 psf | S$1,425 psf | S$1,531 psf |
| Q4 2025 | 9 | S$1,548 psf | S$1,467 psf | S$1,595 psf |
| Q1 2026 | 7 | S$1,529 psf | S$1,509 psf | S$1,543 psf |
| Q2 2026 | 11 | S$1,578 psf | S$1,564 psf | S$1,624 psf |
The largest units trade at the lowest psf, not the highest
Breaking the 40 resales by size gives a clean inversion. The 90 to 119 sqm band was by far the most traded, with 28 resales at a median of S$1,695,000 (S$1,553 psf) on a median area of 1,076 sqft. Below it, the 70 to 89 sqm band recorded 6 resales at a median of S$1,411,500 (S$1,525 psf).
The 120 sqm and above band also recorded 6 resales, at a median price of S$2,200,000 but a median of S$1,489 psf, the lowest of the three. That is the usual quantum effect showing up in the per-area figure. Bigger absolute prices, lower psf.
With 6 sales in each of the outer bands, these medians are thin. A single high floor or a single ground-floor unit with a large private enclosed space can shift either one. The middle band, at 28 sales, is the only one we would read with much confidence.
| Size band | Resales | Median area | Median price | Median psf |
|---|---|---|---|---|
| 70 to 89 sqm | 6 | 926 sqft | S$1,411,500 | S$1,525 psf |
| 90 to 119 sqm | 28 | 1,076 sqft | S$1,695,000 | S$1,553 psf |
| 120 sqm and above | 6 | 1,496 sqft | S$2,200,000 | S$1,489 psf |
Five rental contracts in 1Q2026 put the measured gross yield at about 3.1%
The rental side is much thinner than the resale side. URA rental contracts at Bellewaters show 5 contracts in 1Q2026, at a median of S$4.00 psf a month and a median monthly rent of S$4,250.
Set against the resale median over the window, that works out to a gross yield of about 3.1% on our own engine's calculation. The figure is indicative and built from recorded contracts and recorded resale caveats, not from any formal valuation of a home.
Five contracts is a small base. The table does not record unit size mix or lease length, so the median rent could move on composition alone in the next quarter. It is a reading, not a trend.
| Quarter | Contracts | Median rent (S$ psf a month) | Median monthly rent |
|---|---|---|---|
| Q1 2026 | 5 | 4.0 | S$4,250 |
Within a kilometre, Bellewaters prices between Ecopolitan and The Vales
The neighbour table covers the same four quarters. Twin Waterfalls, 734 m away, recorded the most resales at 47, with a median of S$1,572 psf. The Vales, at 519 m, recorded 38 resales at S$1,616 psf, the highest median among the projects with meaningful volume.
At the other end, Ecopolitan recorded 21 resales at S$1,421 psf, and Treasure Crest 18 resales at S$1,570 psf from 327 m away. Ola shows the highest median in the table at S$1,760 psf, but on 3 sales, which is too few to lean on.
All five are 99-year leasehold. The table does not record TOP year, unit mix or EC versus private status for each, so a straight psf comparison carries those unknowns with it. It tells you where the transacted prices sat, not why they differ.
| Project | Tenure | TOP | Distance | Resales | Median psf |
|---|---|---|---|---|---|
| Twin Waterfalls | 99-year leasehold | — | 734 m | 47 | S$1,572 psf |
| The Vales | 99-year leasehold | — | 519 m | 38 | S$1,617 psf |
| Ecopolitan | 99-year leasehold | — | 725 m | 21 | S$1,421 psf |
| Treasure Crest | 99-year leasehold | — | 327 m | 18 | S$1,570 psf |
| Ola | 99-year leasehold | — | 404 m | 3 | S$1,760 psf |
The top end of the window ran to S$2,300,000, and the highest price was not the highest psf
The single largest price in the four quarters was S$2,300,000 in 1Q2026, for a 1,496 sqft unit in the 06-10 storey range, at S$1,537 psf. A near-identical 1,496 sqft unit in the same storey range traded at S$2,250,000 in 3Q2025, at S$1,504 psf.
Below those, the pattern breaks from floor height. A 1,604 sqft unit on the 16-20 storey range sold for S$2,200,000 in 4Q2025, but at S$1,372 psf, the lowest per-area figure in the list. A 1,335 sqft unit on 11-15 sold for S$2,058,000 at S$1,542 psf, the highest psf of the five.
That is what happens when area varies more than floor level within a small group of sales. The table ranks by price, and price tracks size here more than storey.
| Quarter | Storey range | Area | Price | Per sqft |
|---|---|---|---|---|
| Q1 2026 | 06-10 | 1,496 sqft | S$2,300,000 | S$1,537 psf |
| Q3 2025 | 06-10 | 1,496 sqft | S$2,250,000 | S$1,504 psf |
| Q4 2025 | 16-20 | 1,604 sqft | S$2,200,000 | S$1,372 psf |
| Q3 2025 | 11-15 | 1,528 sqft | S$2,200,000 | S$1,439 psf |
| Q3 2025 | 11-15 | 1,335 sqft | S$2,058,000 | S$1,542 psf |
Our own estimate missed by a median of 4.2% at this project
We run our estimates against later recorded sales to see how they held up. As of 4Q2025, the Bellewaters estimate was tested against 37 later sales. The median error came to 4.2%, and 27% of those sales landed inside the stated range.
The first number says the typical miss was modest. The second says the range we published was too narrow to catch most outcomes at this project. Both are worth reading together rather than apart.
These are measured figures from our engine, against recorded transactions. They describe how an indicative estimate performed at one project over one testing window, nothing more.
In pictures
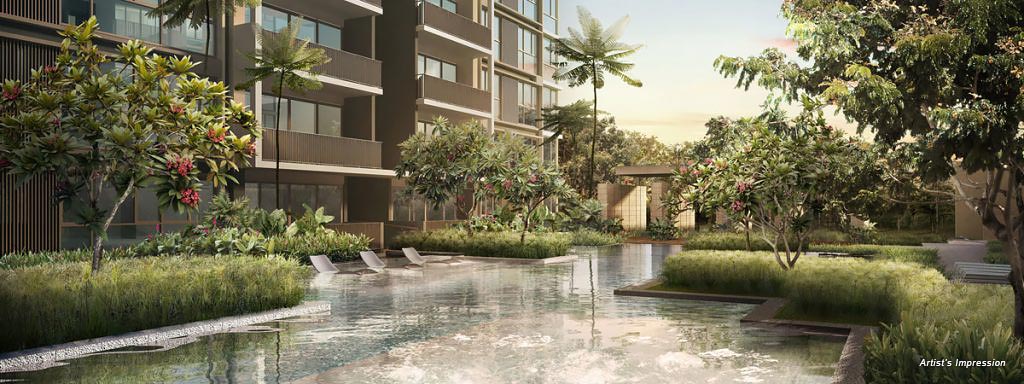
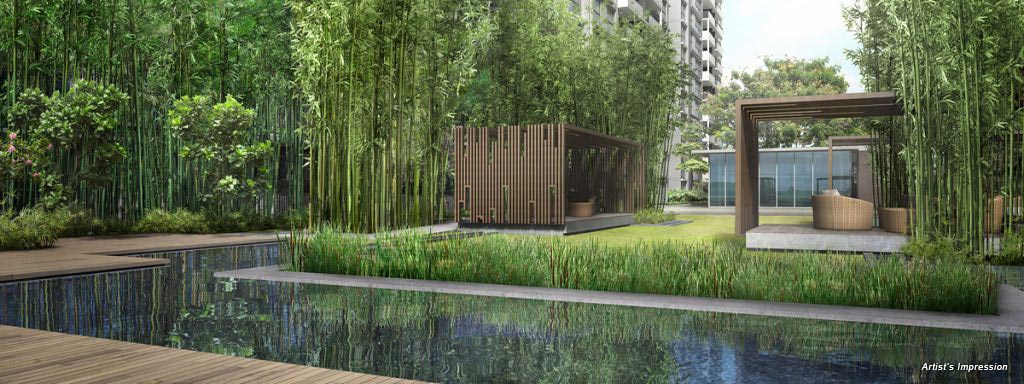
A few things the tables leave open. We have one quarter of rental data and 5 contracts in it, so the yield reading has little behind it yet. The size bands outside 90 to 119 sqm rest on 6 sales each. And the -6.7% gap to the District 19 median covers 2,311 district sales against 40 here, across a district with a very wide mix of projects and tenures. What we would watch in the next quarter's URA caveats is whether the 2Q2026 median of S$1,578 psf holds with more volume behind it, and whether any further rental contracts appear.
One quarterly median rarely settles anything on its own. The eight-quarter line is more useful than any single point on it, and even that sits inside a district and a cluster of neighbours that are moving on their own terms. The value, as always, is in reading the project figure against what the surrounding data is doing at the same time.
Method: URA resale caveats at the project (developer sales and sub-sales excluded) by the quarter of the sale month. Size bands by caveated floor area. Rents are URA rental contracts at the project, and the gross yield is the mean of the quarterly median rents per square foot, annualised, over the four-quarter resale median per square foot, before any cost. Lease left is the tenure less the years since the lease started, as recorded. The estimate accuracy is this site's backtest: the engine run as of the quarter named, compared with the sales since. Private figures are from URA Data Service caveats, HDB figures from data.gov.sg resale records, both loaded weekly by this site's ingest. Medians are of the non-excluded transactions in the period named. Sales flagged by the hygiene rules (related-party transfers, bulk deals, outliers) are left out. Every figure is indicative and drawn from recorded transactions, not a formal valuation.