Bartley Residences: 38 Resales At A Median Of S$1,798 psf — And Two Neighbours Within 227 m Are Pricing Higher
Published 16 Oct 2026 · Bartley Residences
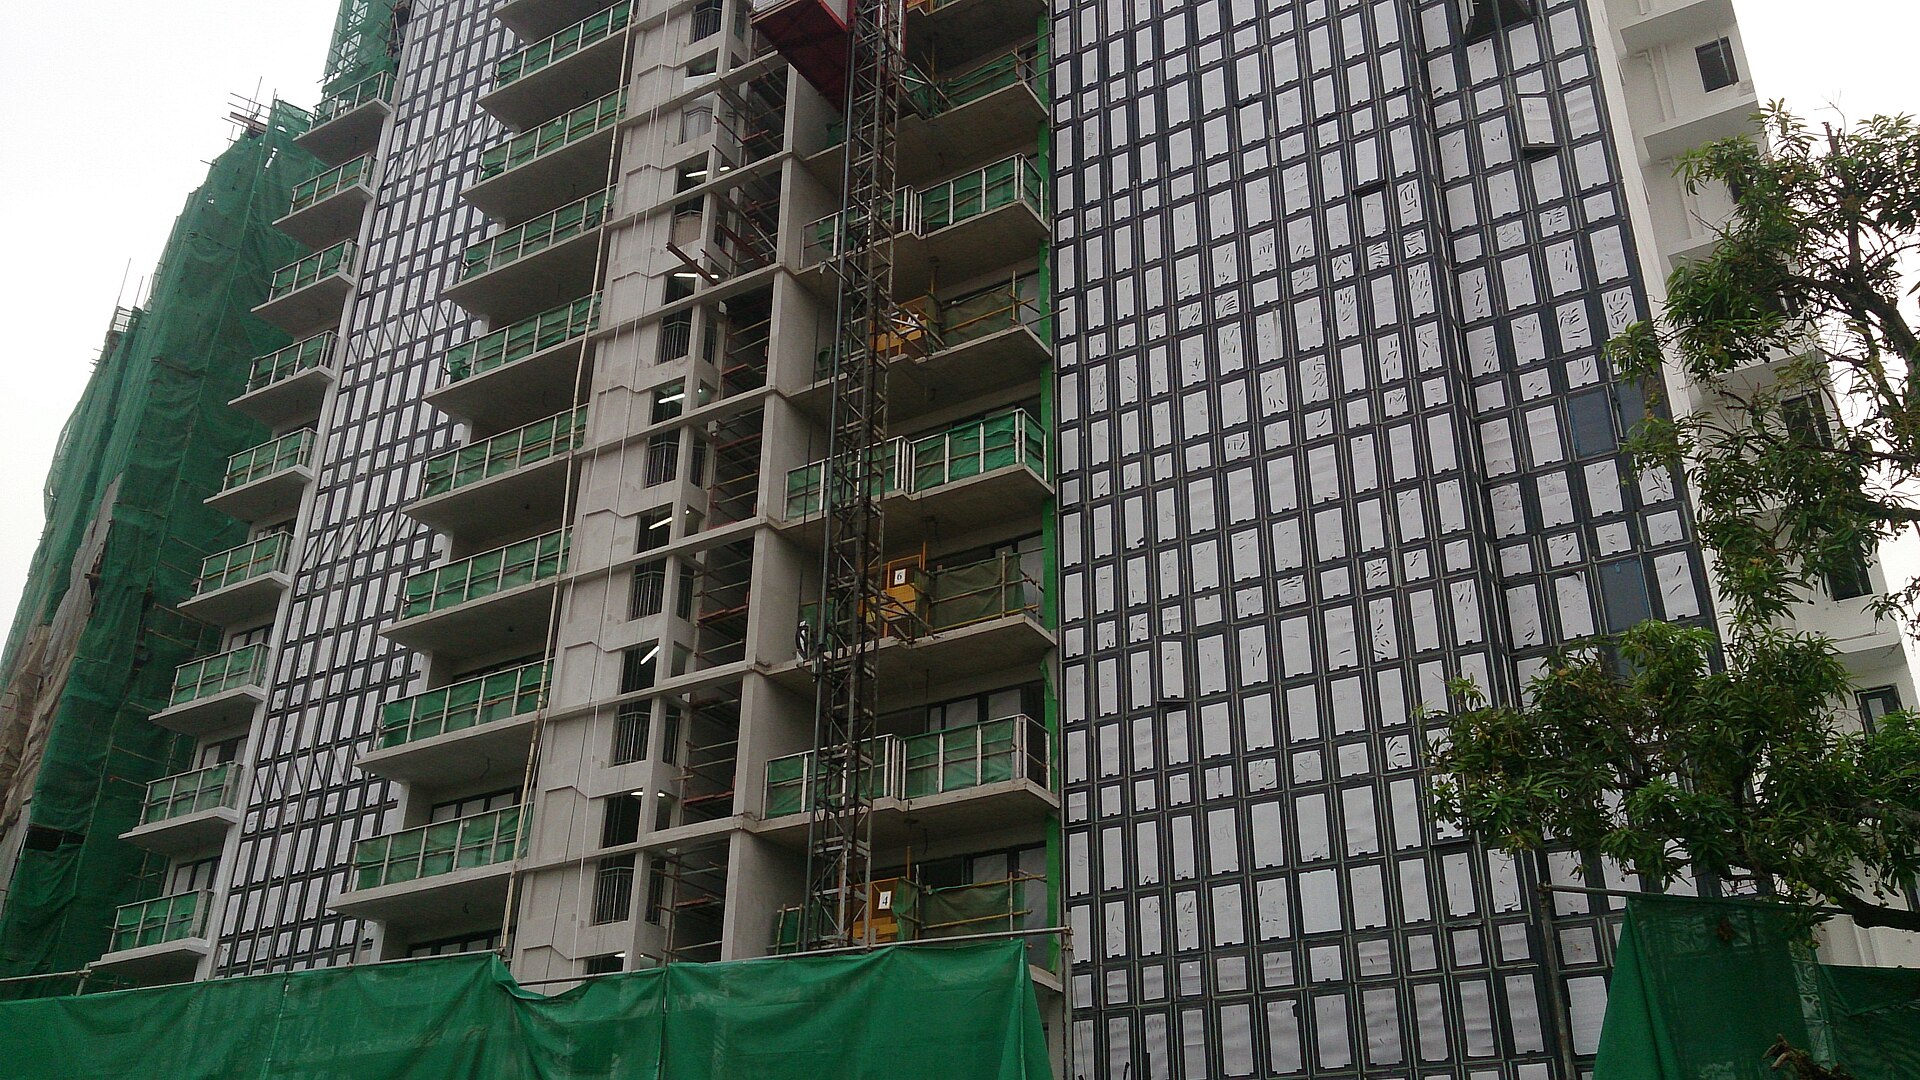
A project median can sit almost still for two years and still hide a lot of movement. Bartley Residences is one of those cases. The quarterly line barely shifts, but the size bands underneath it do not agree with each other, and two leasehold neighbours a short walk away are transacting at higher psf.
According to URA Data Service caveats, Bartley Residences recorded 38 resales over 3Q2025 to 2Q2026 at a median of S$1,798 psf. It is a 99 apartment project in District 19, with 84 years of lease left. Across the eight quarters we pulled, the quarterly resale median moved +1.2%, from S$1,772 psf in 3Q2024 on 5 sales to S$1,793 psf in 2Q2026 on 5 sales. Over the same four quarters, the District 19 resale median was S$1,644 psf from 2,311 sales. On that comparison, Bartley Residences sits +9.4% above its district. Here is what stood out to us in the tables.
The quarterly median has gone almost nowhere in two years, but the path was not flat
Start with the quarter-by-quarter line. The first and last readings are close. In between, the median climbed to S$1,858 psf in 4Q2024, slipped back to S$1,791 psf in 1Q2025, then held near that level through 2Q2025 and 3Q2025. It picked up again to S$1,880 psf in 4Q2025, the highest of the eight quarters shown. By 2Q2026 it was back at S$1,793 psf. So the net change is small. The route there was not.
Volume matters when you read this. 3Q2025 carried 18 resales, by far the busiest quarter in the window. 2Q2026 had 5. A median built on 5 sales moves easily, and a single large or small unit can tilt it. The chart below plots the same series with counts attached, so you can see which points rest on thin trading.
The spread columns are worth a glance as well. In most quarters the lower and upper figures sit within roughly the same band as the median. In 2Q2026 the lower figure drops to S$1,595 psf while the upper figure matches the median at S$1,793 psf. That is a wider gap than the quarters before it. With 5 sales, the table cannot tell us whether that reflects mix, floor level or unit size.
| Quarter | Resales | Median psf | 25th percentile | 75th percentile |
|---|---|---|---|---|
| Q3 2024 | 5 | S$1,772 psf | S$1,768 psf | S$1,776 psf |
| Q4 2024 | 7 | S$1,858 psf | S$1,819 psf | S$1,870 psf |
| Q1 2025 | 10 | S$1,791 psf | S$1,771 psf | S$1,877 psf |
| Q2 2025 | 7 | S$1,793 psf | S$1,773 psf | S$1,810 psf |
| Q3 2025 | 18 | S$1,794 psf | S$1,782 psf | S$1,855 psf |
| Q4 2025 | 7 | S$1,880 psf | S$1,726 psf | S$1,902 psf |
| Q1 2026 | 8 | S$1,859 psf | S$1,812 psf | S$1,900 psf |
| Q2 2026 | 5 | S$1,793 psf | S$1,595 psf | S$1,793 psf |
The size bands are not moving in the same direction
Split the 38 resales by floor area and the picture gets more textured. Units of 70 to 89 sqm were the most traded band, with 14 resales at a median of S$1,615,000, or S$1,828 psf, on a median area of 872 sqft. The 90 to 119 sqm band was close behind on count, 12 resales, and higher on rate, at a median of S$2,015,000 and S$1,867 psf. That band had the highest median psf of the five.
The smallest units did not command the highest rate here. Units under 50 sqm, 6 resales, cleared a median of S$827,500 at S$1,788 psf on a median area of 463 sqft. That is below both of the mid bands. The 50 to 69 sqm band shows S$1,591 psf, the lowest in the table, but it rests on 2 resales only. We would not read much into it.
At the top end, 4 resales of 120 sqm and above posted a median of S$2,702,500 at S$1,762 psf on 1,491 sqft. Larger areas and lower psf is a familiar shape. The table below sets out all five bands.
| Size band | Resales | Median area | Median price | Median psf |
|---|---|---|---|---|
| under 50 sqm | 6 | 463 sqft | S$827,500 | S$1,788 psf |
| 50 to 69 sqm | 2 | 565 sqft | S$899,000 | S$1,591 psf |
| 70 to 89 sqm | 14 | 872 sqft | S$1,615,000 | S$1,828 psf |
| 90 to 119 sqm | 12 | 1,098 sqft | S$2,015,000 | S$1,867 psf |
| 120 sqm and above | 4 | 1,491 sqft | S$2,702,500 | S$1,762 psf |
The largest cheque in the window came with the lowest psf of the top five sales
The biggest price recorded over 3Q2025 to 2Q2026 was S$2,760,000 in 3Q2025. That was a 1,798 sqft unit on the 16-20 storey range, which works out in the caveat to S$1,535 psf. It is the lowest rate among the five largest sales listed.
Just behind it, a 1,345 sqft unit on the 06-10 range sold for S$2,740,000 in 1Q2026, at S$2,036 psf. The same size on the same storey band transacted at S$2,665,000 in 4Q2025, at S$1,981 psf. A 1,163 sqft unit on the 11-15 range went at S$2,310,000 in 3Q2025, at S$1,987 psf. So the top prices split into two groups: very large units at lower psf, and mid-sized units at the highest psf in the project.
This is the clearest reminder in the pack that headline price and headline rate answer different questions. All of these are recorded transactions, not valuations. The table below lists them in order of price.
| Quarter | Storey range | Area | Price | Per sqft |
|---|---|---|---|---|
| Q3 2025 | 16-20 | 1,798 sqft | S$2,760,000 | S$1,535 psf |
| Q1 2026 | 06-10 | 1,345 sqft | S$2,740,000 | S$2,036 psf |
| Q4 2025 | 06-10 | 1,345 sqft | S$2,665,000 | S$1,981 psf |
| Q1 2026 | 11-15 | 1,636 sqft | S$2,525,000 | S$1,543 psf |
| Q3 2025 | 11-15 | 1,163 sqft | S$2,310,000 | S$1,987 psf |
Rental contract volume stayed high while the median rent kept climbing
The rental side has its own rhythm. URA rental contracts at Bartley Residences numbered 54 in 3Q2025, with a median of 6.4 psf a month and a median monthly rent of S$3,050. The next three quarters look different. Contracts came in at 31, then 38, then 39. The median psf a month settled at 5.1 across all three.
Median monthly rent went the other way. It moved from S$3,800 in 4Q2025 to S$3,750 in 1Q2026, then to S$4,000 in 2Q2026, the highest of the four quarters. A higher monthly rent on a steady psf rate points to a mix shift towards larger leased units. The table does not break contracts down by size, so we cannot confirm that from this data alone.
For 2Q2026, the project recorded 39 contracts at a median of S$5.13 psf a month. Set against the resale median for the window, our engine measures a gross yield of about 3.6%. That is a measured figure from recorded rents and recorded resales, not a projection.
| Quarter | Contracts | Median rent (S$ psf a month) | Median monthly rent |
|---|---|---|---|
| Q3 2025 | 54 | 6.4 | S$3,050 |
| Q4 2025 | 31 | 5.1 | S$3,800 |
| Q1 2026 | 38 | 5.1 | S$3,750 |
| Q2 2026 | 39 | 5.1 | S$4,000 |
Botanique At Bartley and Bartley Ridge both cleared higher psf than Bartley Residences
Now the neighbours. Within 1 km, the two busiest projects over the same four quarters are both 99-year leasehold and both very close. Botanique At Bartley, 204 m away, recorded 55 resales at a median of S$2,008 psf. Bartley Ridge, 227 m away, recorded 46 resales at S$2,006 psf. Both sit above the S$1,798 psf median at Bartley Residences.
Freehold projects in the ring run higher still on rate, though on thinner counts. The Gazania posted S$2,383 psf from 9 resales at 283 m. Sennett Estate posted S$2,276 psf from 26 resales at 968 m. Not every freehold name is above, though. Kensington Square shows S$1,700 psf from 8 sales, and The Quinn S$1,584 psf, also from 8. The Minton, leasehold and 964 m out, recorded 41 resales at S$1,575 psf.
So tenure alone does not sort this table. Age, size mix and location inside the ring all sit behind these medians, and the pack does not separate them. Against the wider District 19 median of S$1,644 psf from 2,311 sales, Bartley Residences is the higher figure. Against its two nearest leasehold neighbours, it is the lower one.
| Project | Tenure | TOP | Distance | Resales | Median psf |
|---|---|---|---|---|---|
| Botanique At Bartley | 99-year leasehold | — | 204 m | 55 | S$2,008 psf |
| Bartley Ridge | 99-year leasehold | — | 227 m | 46 | S$2,006 psf |
| The Minton | 99-year leasehold | — | 964 m | 41 | S$1,575 psf |
| Sennett Estate | freehold | — | 968 m | 26 | S$2,276 psf |
| The Gazania | freehold | — | 283 m | 9 | S$2,383 psf |
| Kensington Square | freehold | — | 391 m | 8 | S$1,700 psf |
| The Quinn | freehold | — | 815 m | 8 | S$1,584 psf |
| Jade Residences | freehold | — | 745 m | 6 | S$1,644 psf |
Our own estimate missed by a median of 4.2% at this project
One last check, and it is on us rather than the market. We test our estimate against sales that happen after it is made. At Bartley Residences, as of 4Q2025, 20 later sales were tested. The median error was 4.2%. Fifteen per cent of those sales landed inside the stated range.
That hit rate is low, and it is worth saying plainly. The median error tells you how far the central figure typically sat from the recorded price. The range figure tells you how often the band captured the sale outright. A project with wide dispersion between small and large units, as the size bands here show, is harder to pin down with one number. Treat the estimate as indicative and read it next to the caveats, not instead of them.
What the tables leave open is whether the 2Q2026 reading marks a genuine step down or just a thin quarter. Five sales is not much to go on. The wider spread in that quarter hints at mix rather than direction, but the data cannot settle it. The next quarter of caveats will say more, particularly if volume returns to anything like the 18 resales seen in 3Q2025. On the rental side, the question is whether median monthly rent holds at S$4,000 while the psf rate stays at 5.1. That combination is what a mix shift would look like, and another quarter of contracts would test it.
A single median rarely carries a project on its own. This one has barely moved in two years, yet the bands beneath it disagree, the top sales split by size, and two neighbours within a short walk price higher. The value is in how those pieces line up, not in any one row. We will pick the series up again when the next quarter of URA caveats lands.
Method: URA resale caveats at the project (developer sales and sub-sales excluded) by the quarter of the sale month. Size bands by caveated floor area. Rents are URA rental contracts at the project, and the gross yield is the mean of the quarterly median rents per square foot, annualised, over the four-quarter resale median per square foot, before any cost. Lease left is the tenure less the years since the lease started, as recorded. The estimate accuracy is this site's backtest: the engine run as of the quarter named, compared with the sales since. Private figures are from URA Data Service caveats, HDB figures from data.gov.sg resale records, both loaded weekly by this site's ingest. Medians are of the non-excluded transactions in the period named. Sales flagged by the hygiene rules (related-party transfers, bulk deals, outliers) are left out. Every figure is indicative and drawn from recorded transactions, not a formal valuation.