Yishun HDB Resale Median Slips To $5,984 psm In 3Q2026 — But Million-Dollar Flat Sales Are Back At 6
Published 17 Nov 2026
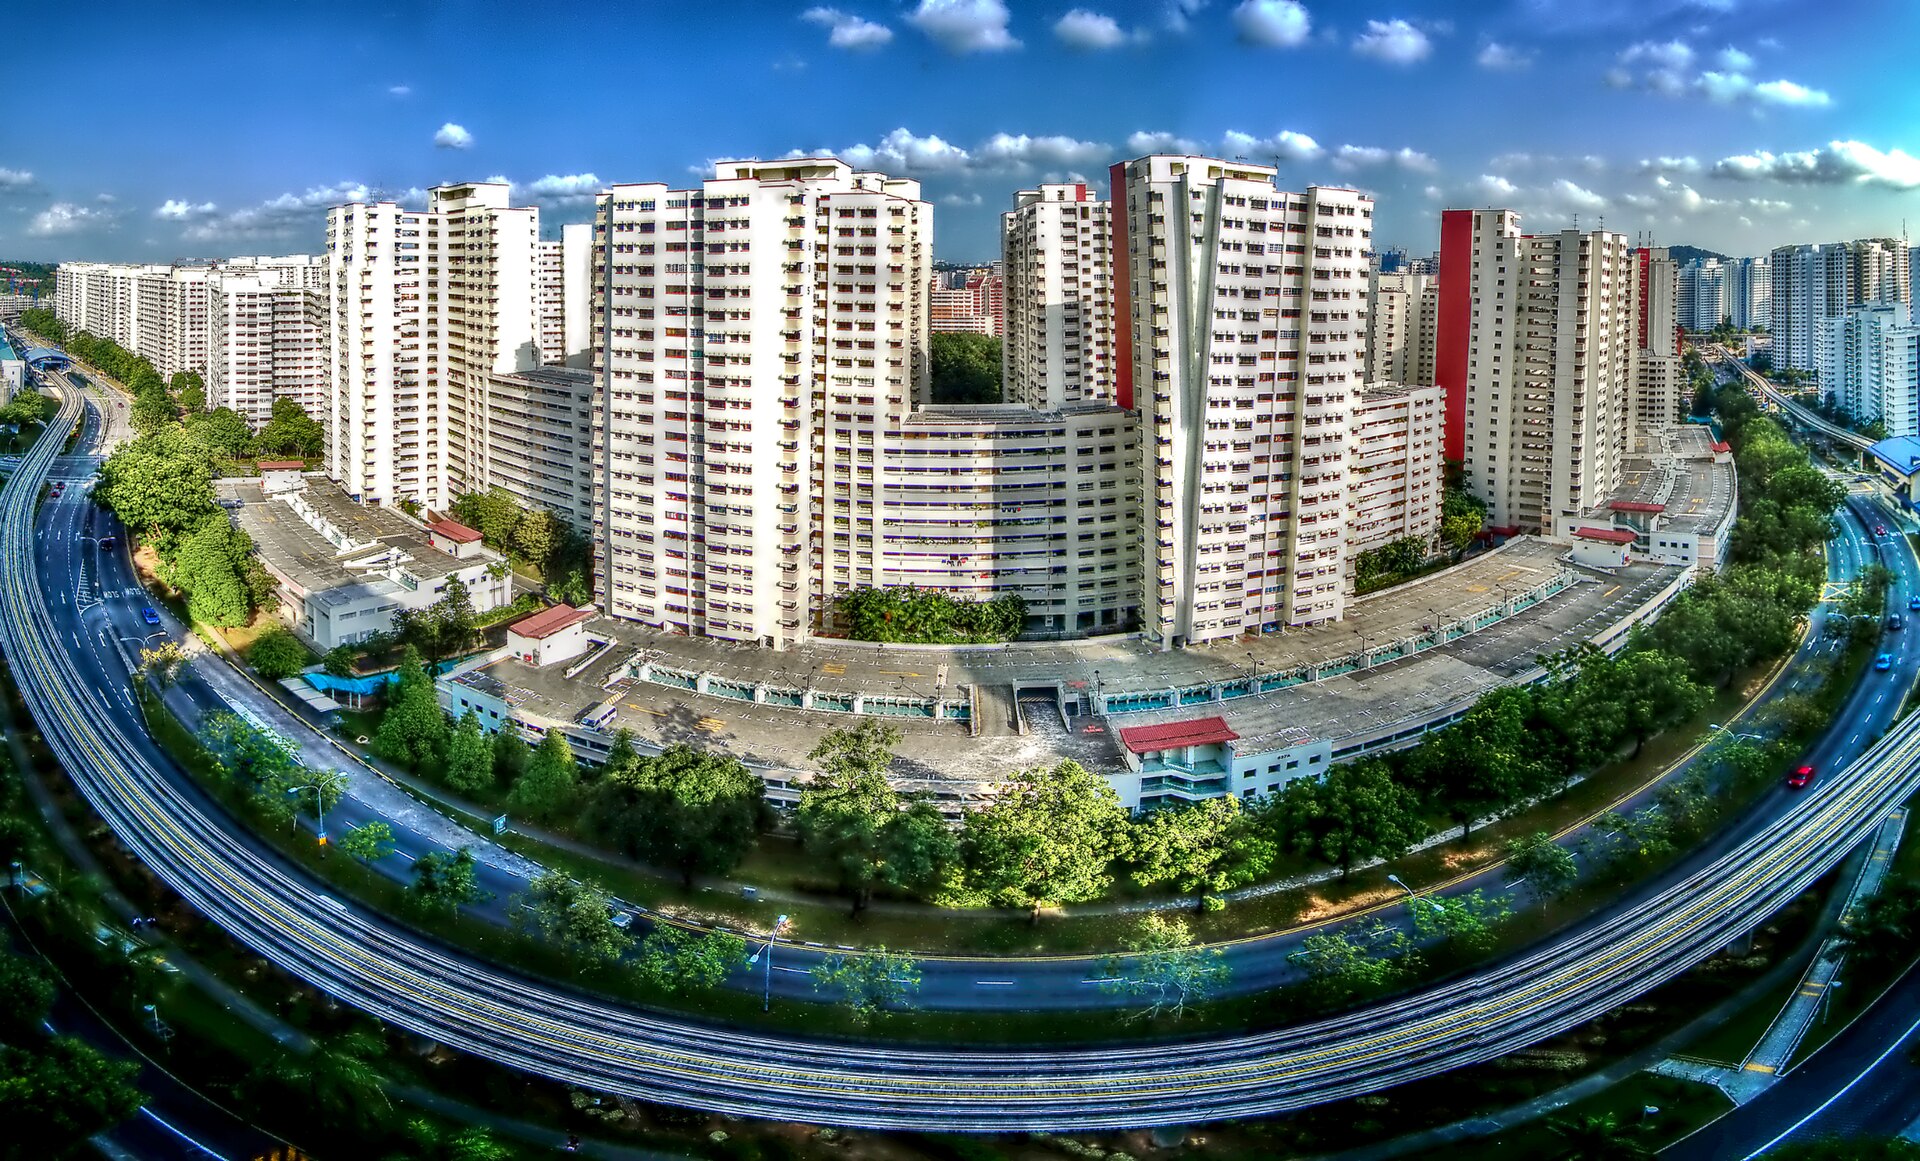
Yishun's HDB resale prices are lower than a year ago, yet the top of the town's market looks much as it did. Those two facts sit side by side in the 3Q2026 figures.
According to data.gov.sg HDB resale records, Yishun recorded 457 resales in 3Q2026 at a median of $5,984 psm and a median price of $540,000. That is -5.1% on psm and -2.8% on price against 3Q2025, when the town had 460 sales. Island-wide, the HDB resale median psm moved -1.1% over the same year. 6 of the quarter's Yishun resales were at $1 million or more, against 6 a year earlier. Every figure here is indicative and comes from recorded transactions, not from a formal valuation of any home. Below, we walk through eight quarters of medians, the flat-type breakdown and the quarter's highest prices.
Yishun's median psm has now eased for four straight quarters
Start with the trend line. Yishun's median was $6,304 psm in 3Q2025, the highest of the eight quarters we track. It has eased in every quarter since: $6,176 psm in 4Q2025, $6,149 psm in 1Q2026, $6,082 psm in 2Q2026 and now $5,984 psm in 3Q2026. That makes four straight quarterly declines. The chart below plots all eight quarters, starting from $6,029 psm in 4Q2024 on 381 sales. Each point is a median of recorded resale transactions, so it reflects whichever flats happened to change hands that quarter. A quarter with a heavier share of larger or smaller flats can nudge the figure on its own.
The longer view is flatter than the recent run suggests. Since 4Q2024 the town's median psm has moved -0.8%, from $6,029 psm on 381 sales. The year-on-year picture is sharper. Yishun is -5.1% on 3Q2025, while the island-wide HDB resale median psm moved -1.1% over the same year. That points to Yishun easing by more than the island as a whole over those twelve months. What the chart cannot settle is how much of that gap comes from flat mix rather than from like-for-like prices. The flat-type table further down gets closer to that question.
Median price has been less tidy than psm, and million-dollar sales are back at 6
The table below adds median price, sales and the count of resales at $1 million or more. The median price does not follow the psm line. It was $555,444 in 3Q2025, then $540,000 in 4Q2025, $548,000 in 1Q2026 and $522,888 in 2Q2026. In 3Q2026 it came back to $540,000. Against 3Q2025 that is -2.8%. So the price median has moved up and down over the last four quarters while psm has dropped in each one. The two measures can part ways because psm depends on floor area, and the mix of flat sizes sold changes from quarter to quarter.
Volume swings too. 4Q2025 had 311 sales, the lowest in the table, and 3Q2026 had 457, against 460 a year earlier. Resales at $1 million or more numbered 6 in 3Q2026, the same as in 3Q2025. The count was 1 in 4Q2024 and 1Q2026, 3 in 1Q2025 and 4Q2025, 2 in 2Q2025 and 4 in 2Q2026. Counts this small move with a handful of flats, so we would not read a trend into them. They do show that a lower median psm and a high count of million-dollar resales can sit in the same quarter.
| Quarter | Median psm | Median price | Sales | At S$1m or more |
|---|---|---|---|---|
| Q4 2024 | S$6,029 psm | S$535,000 | 381 | 1 |
| Q1 2025 | S$6,176 psm | S$530,000 | 407 | 3 |
| Q2 2025 | S$6,206 psm | S$550,000 | 471 | 2 |
| Q3 2025 | S$6,304 psm | S$555,444 | 460 | 6 |
| Q4 2025 | S$6,176 psm | S$540,000 | 311 | 3 |
| Q1 2026 | S$6,149 psm | S$548,000 | 387 | 1 |
| Q2 2026 | S$6,082 psm | S$522,888 | 356 | 4 |
| Q3 2026 | S$5,984 psm | S$540,000 | 457 | 6 |
Every flat type sold at a lower median price than a year earlier, with 5-room down the most
Next, the breakdown by flat type against 3Q2025. All five types are lower. The 4-room, the biggest group at 224 sales, sits at $550,000, -3.5% from $570,000. The 3-room has 112 sales at $435,000, -2.2% from $444,944, the smallest fall of the five. The 5-room is down the most, at $679,000 against $721,000, or -5.8% on the year, from 86 sales. The change column compares median prices, not psm, so it is less exposed to differences in floor area between types. The psm column gives a different order: 2-room at $7,660 psm, 3-room at $6,250 psm, executive at $6,164 psm, 4-room at $5,845 psm and 5-room at $5,656 psm.
Two rows need care. The 2-room has just 12 sales, at $359,000, -3.2% from $371,000. The executive row has 21 sales, at $905,000, -2.7% from $930,000. Small counts move a median far more than large ones. The fall across all five types points to a dip that is not confined to one segment. The table cannot say how much of each change comes from differences in floor level, lease or block between this year's flats and last year's. It compares medians of two different sets of flats.
| Flat type | Median price Q3 2026 | Median psm | Sales | Median price Q3 2025 | Change |
|---|---|---|---|---|---|
| Yishun 2-room | S$359,000 | S$7,660 psm | 12 | S$371,000 | -3.2% |
| Yishun 3-room | S$435,000 | S$6,250 psm | 112 | S$444,944 | -2.2% |
| Yishun 4-room | S$550,000 | S$5,845 psm | 224 | S$570,000 | -3.5% |
| Yishun 5-room | S$679,000 | S$5,656 psm | 86 | S$721,000 | -5.8% |
| Yishun executive | S$905,000 | S$6,164 psm | 21 | S$930,000 | -2.7% |
Multi-generation flats took the top two spots among the quarter's highest prices
The table below lists the five highest-priced resales in Yishun in 3Q2026. The top price was $1,212,000 for a multi-generation flat at Blk 666 Yishun Ave 4. It is a 151 sqm unit on the 10 TO 12 storey range, at $8,026 psm, with 60 years of lease left. A second multi-generation flat, at Blk 605 Yishun St 61, went for $1,190,000. That one is 163 sqm, on the 07 TO 09 range, at $7,301 psm, with 61 years left.
The other three are executive flats. Blk 663A Yishun Ave 4 sold for $1,075,000 and Blk 664A Yishun Ave 4 for $1,038,000. Both are 164 sqm, on the 01 TO 03 range, with 65 years left. Blk 877 Yishun St 81 sold for $1,015,000 at $7,000 psm, from 145 sqm on the 07 TO 09 range, with 60 years left. Its psm is higher than either of the two larger executive flats, so price order and psm order differ. These rows are single transactions. They show what the top of the quarter looked like, not what a typical Yishun flat cost.
| Block | Flat type | Storey range | Area | Price | Per sqm | Lease left (years) |
|---|---|---|---|---|---|---|
| Blk 666 Yishun Ave 4 | multi-generation | 10 TO 12 | 151 sqm | S$1,212,000 | S$8,026 psm | 60 |
| Blk 605 Yishun St 61 | multi-generation | 07 TO 09 | 163 sqm | S$1,190,000 | S$7,301 psm | 61 |
| Blk 663A Yishun Ave 4 | executive | 01 TO 03 | 164 sqm | S$1,075,000 | S$6,555 psm | 65 |
| Blk 664A Yishun Ave 4 | executive | 01 TO 03 | 164 sqm | S$1,038,000 | S$6,329 psm | 65 |
| Blk 877 Yishun St 81 | executive | 07 TO 09 | 145 sqm | S$1,015,000 | S$7,000 psm | 60 |
The figures leave several things open. Four straight quarters of lower median psm is a run, but the series is only eight quarters long and the sales count moves a lot between them. We do not know from this data how much of the slide reflects flat mix. The next quarter's data will show whether the median psm moves again, how sales compare with 457, and how many resales reach $1 million or more.
A single headline figure is rarely enough on its own. Here, a lower median sits next to an unchanged count of million-dollar resales, and each tells only part of the story. The value lies in how these numbers fit the broader direction of the market over several quarters. We will keep tracking them as the next quarter's records come in.
Method: HDB resale records grouped by town and by the quarter of the sale month. Medians are of price and of price per square metre. Flat types with fewer than five sales in the quarter are omitted from the breakdown. Lease left is rounded to whole years as at the sale. Private figures are from URA Data Service caveats, HDB figures from data.gov.sg resale records, both loaded weekly by this site's ingest. Medians are of the non-excluded transactions in the period named. Sales flagged by the hygiene rules (related-party transfers, bulk deals, outliers) are left out. Every figure is indicative and drawn from recorded transactions, not a formal valuation.