Woodlands HDB resale median at S$5,660 psm in 2Q2026, down 1.4% y-o-y from 460 sales
Published 5 Oct 2026
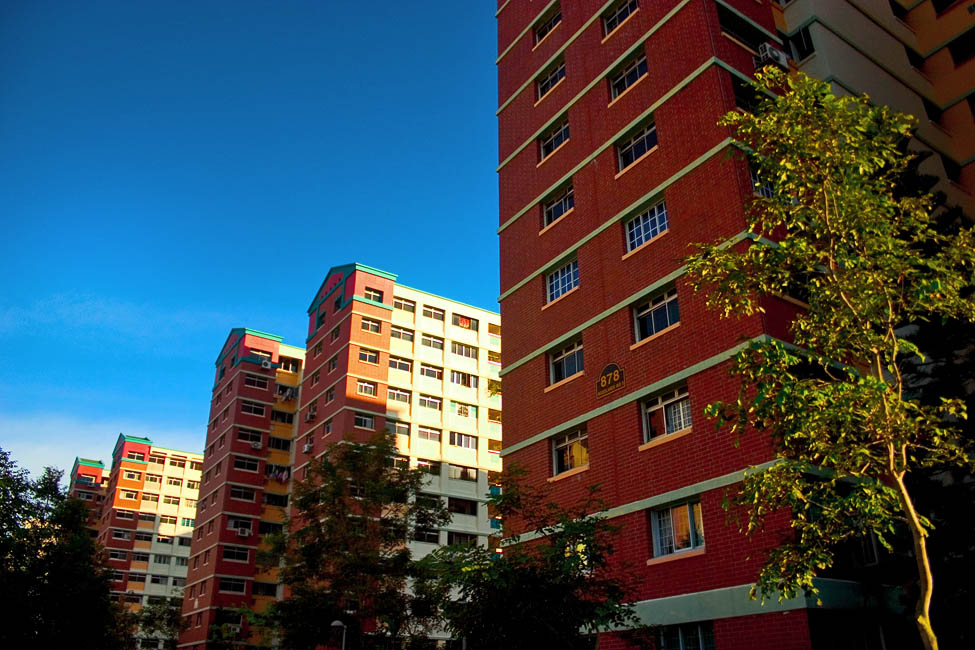
Woodlands recorded 460 HDB resales in 2Q2026 at a median of S$5,660 psm and a median price of S$606,333. The median psm was 1.4% lower y-o-y while the median price was 1.4% higher — the two measures moved in opposite directions as the mix of flats sold shifted.
A year earlier, in 2Q2025, the town saw 471 resales at a median of S$5,738 psm and a median price of S$598,000, based on HDB resale records published on data.gov.sg. Island-wide, the HDB resale median psm moved 0.4% lower over the same year.
Median psm little changed from 1Q2026
The town's median of S$5,660 psm in 2Q2026 follows S$5,659 psm in 1Q2026 and S$5,774 psm in 4Q2025. The series peaked at S$5,787 psm in 3Q2025.
Over the eight quarters charted, the median psm has moved 1.7% from S$5,568 psm in 3Q2024, when 543 flats changed hands. The chart below tracks the quarterly medians and the sale count behind each.
Resale volume rose q-o-q to 460
Volume in Woodlands came in at 460 sales in 2Q2026, after 448 in 1Q2026 and 355 in 4Q2025, the lowest count in the eight quarters. The highest was 543 in 3Q2024.
The quarter's median price of S$606,333 is the highest in the table below, which also shows the count of resales at S$1 million or more in each quarter.
| Quarter | Median psm | Median price | Sales | At S$1m or more |
|---|---|---|---|---|
| Q3 2024 | S$5,568 psm | S$575,000 | 543 | 10 |
| Q4 2024 | S$5,590 psm | S$599,444 | 482 | 8 |
| Q1 2025 | S$5,658 psm | S$585,888 | 439 | 5 |
| Q2 2025 | S$5,738 psm | S$598,000 | 471 | 9 |
| Q3 2025 | S$5,787 psm | S$600,488 | 442 | 8 |
| Q4 2025 | S$5,774 psm | S$578,000 | 355 | 7 |
| Q1 2026 | S$5,659 psm | S$581,500 | 448 | 8 |
| Q2 2026 | S$5,660 psm | S$606,333 | 460 | 12 |
Four-room flats accounted for 212 of the quarter's resales
Four-room flats recorded a median price of S$550,000 at S$5,585 psm from 212 sales, against a median of S$560,000 in 2Q2025. Five-room flats posted a median of S$658,000 at S$5,482 psm from 140 sales, down 2.1% y-o-y.
Executive flats were the only larger type to record a higher median, at S$918,000 from 53 sales, up 3.1% y-o-y. Two-room flats, on six sales, had a median of S$374,000 at S$7,957 psm, the highest psm among the flat types in the table below.
| Flat type | Median price Q2 2026 | Median psm | Sales | Median price Q2 2025 | Change |
|---|---|---|---|---|---|
| Woodlands 2-room | S$374,000 | S$7,957 psm | 6 | S$360,000 | +3.9% |
| Woodlands 3-room | S$430,000 | S$6,027 psm | 49 | S$439,000 | -2.1% |
| Woodlands 4-room | S$550,000 | S$5,585 psm | 212 | S$560,000 | -1.8% |
| Woodlands 5-room | S$658,000 | S$5,482 psm | 140 | S$672,000 | -2.1% |
| Woodlands executive | S$918,000 | S$6,071 psm | 53 | S$890,000 | +3.1% |
Executive flats took the five highest prices
The quarter's highest price in Woodlands was S$1,180,000 for an executive flat at Blk 805 Woodlands St 81. The 189 sqm unit, on the 10 to 12 storey range, worked out to S$6,243 psm with 67 years of lease left.
Two of the five highest-priced resales were at Blk 342 Woodlands Ave 1, at S$1,100,000 and S$1,080,000, both on the 07 to 09 storey range with 68 years of lease left. All five units in the table below are executive flats of 176 sqm or larger.
| Block | Flat type | Storey range | Area | Price | Per sqm | Lease left (years) |
|---|---|---|---|---|---|---|
| Blk 805 Woodlands St 81 | executive | 10 TO 12 | 189 sqm | S$1,180,000 | S$6,243 psm | 67 |
| Blk 342 Woodlands Ave 1 | executive | 07 TO 09 | 177 sqm | S$1,100,000 | S$6,215 psm | 68 |
| Blk 405 Woodlands St 41 | executive | 10 TO 12 | 176 sqm | S$1,083,000 | S$6,153 psm | 68 |
| Blk 342 Woodlands Ave 1 | executive | 07 TO 09 | 179 sqm | S$1,080,000 | S$6,034 psm | 68 |
| Blk 808 Woodlands St 81 | executive | 04 TO 06 | 189 sqm | S$1,080,000 | S$5,714 psm | 67 |
Twelve resales in Woodlands crossed S$1 million in 2Q2026, against nine in 2Q2025 and eight in 1Q2026. It is the highest count of such transactions in the eight quarters covered.
Method: HDB resale records grouped by town and by the quarter of the sale month. Medians are of price and of price per square metre. Flat types with fewer than five sales in the quarter are omitted from the breakdown. Lease left is rounded to whole years as at the sale. Private figures are from URA Data Service caveats, HDB figures from data.gov.sg resale records, both loaded weekly by this site's ingest. Medians are of the non-excluded transactions in the period named. Sales flagged by the hygiene rules (related-party transfers, bulk deals, outliers) are left out. Every figure is indicative and drawn from recorded transactions, not a formal valuation.