Toa Payoh's Median HDB Resale Hit S$8,166 Psm In 2Q2026 — But The Median Price Fell 1.3% On The Year
Published 30 Sept 2026
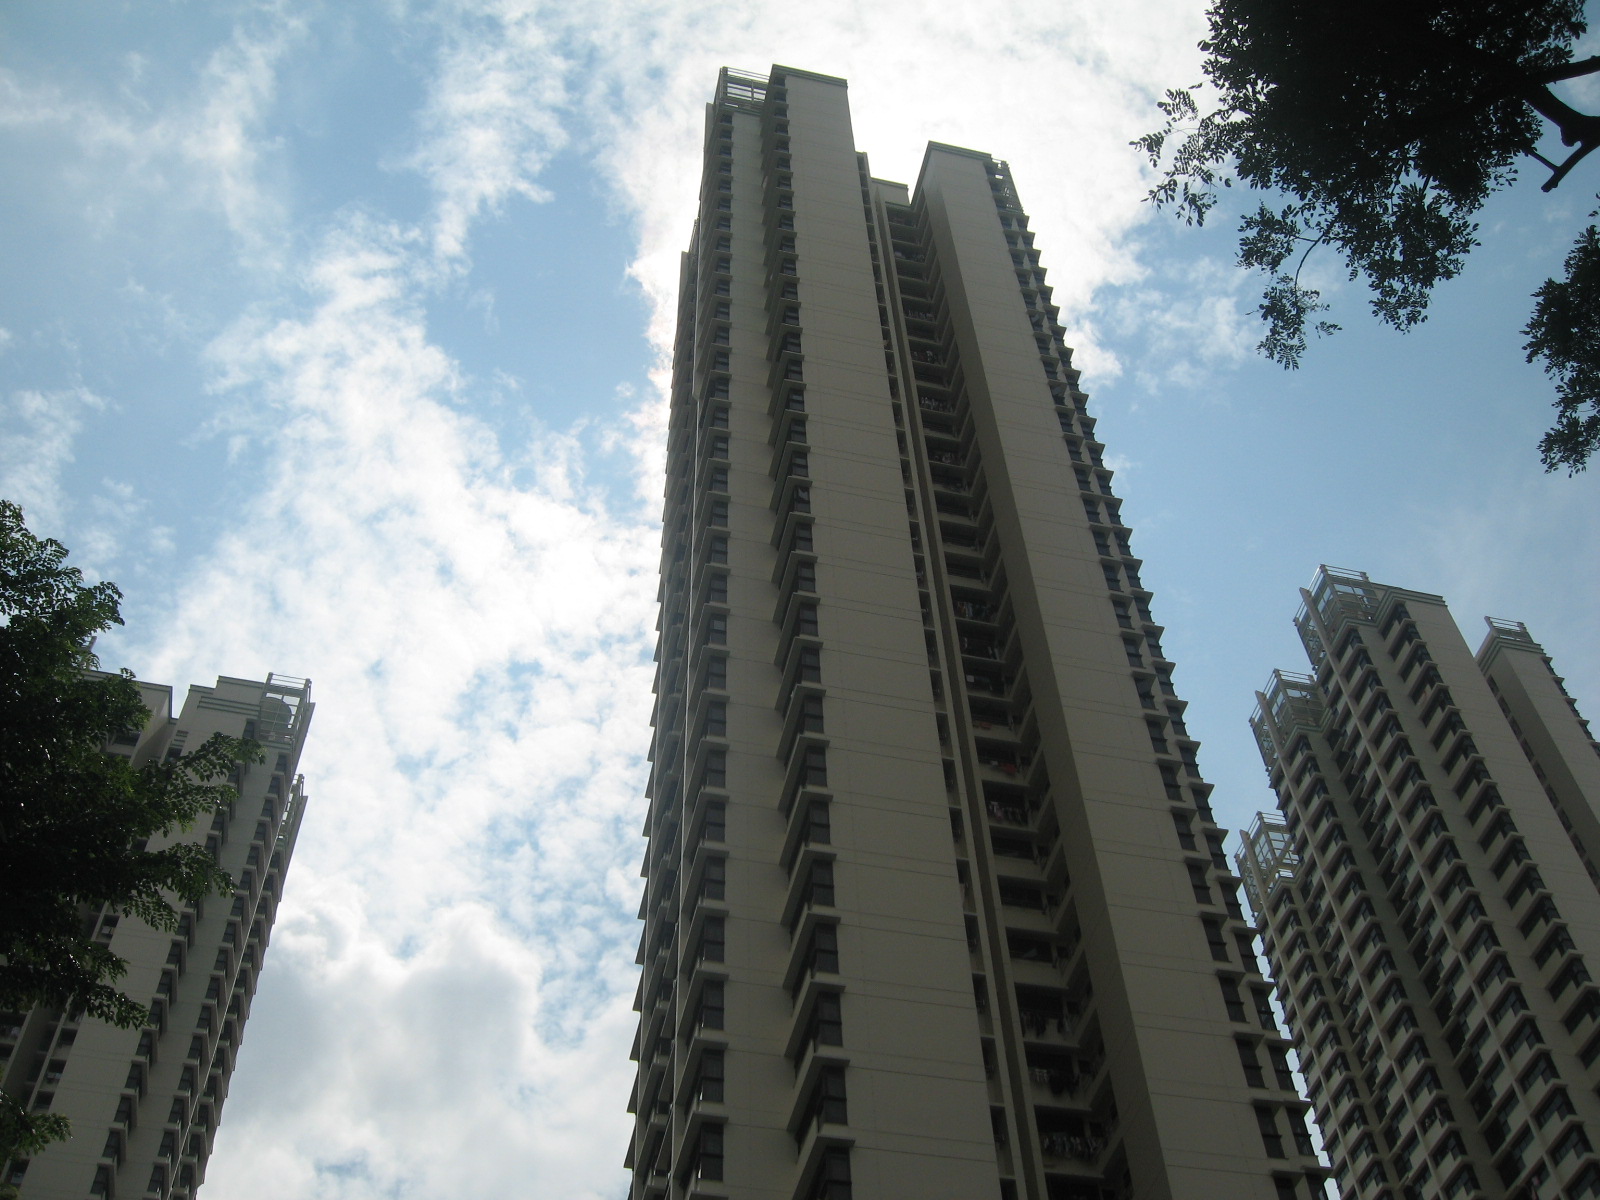
A town can look dearer and cheaper in the same quarter. Toa Payoh did exactly that in 2Q2026. One median went up, the other went down, and both came from the same set of transactions.
According to HDB resale records published on data.gov.sg, Toa Payoh recorded 228 resales in 2Q2026 at a median of S$8,166 psm and a median price of S$787,388. That is +2.4% on psm and -1.3% on price against 2Q2025, when the town saw 279 sales. Over the same year, the island-wide HDB resale median psm moved -0.4%. Here is what stood out to us as we went through the town's last eight quarters.
Toa Payoh's median per square metre went up while its median price went down
The two headline numbers point opposite ways. The per-square-metre median rose 2.4% against 2Q2025. The median price fell 1.3% over the same stretch. Both are drawn from the same 228 transactions, so neither is wrong. They simply measure different things. One divides price by floor area. The other does not. A quarter with a heavier share of smaller flats can lift the psm median while pulling the price median down. The table below cannot settle how much of the gap is mix, because it records outcomes rather than composition.
Volume is the other thing worth reading slowly. The town logged 279 sales in 2Q2025 and 232 in 4Q2025. Sales at S$1 million or more came in at 66 this quarter, against 80 a year earlier and 91 in 3Q2025. So the count of seven-figure deals has come off its high in the series, even as the town's per-square-metre median set the highest reading of these eight quarters. Again, these are recorded resale prices, not appraisals of any particular flat.
| Quarter | Median psm | Median price | Sales | At S$1m or more |
|---|---|---|---|---|
| Q3 2024 | S$6,496 psm | S$645,000 | 225 | 33 |
| Q4 2024 | S$7,115 psm | S$738,000 | 181 | 58 |
| Q1 2025 | S$7,648 psm | S$784,000 | 232 | 67 |
| Q2 2025 | S$7,973 psm | S$798,000 | 279 | 80 |
| Q3 2025 | S$7,973 psm | S$800,000 | 283 | 91 |
| Q4 2025 | S$7,637 psm | S$694,000 | 232 | 62 |
| Q1 2026 | S$7,714 psm | S$780,000 | 225 | 68 |
| Q2 2026 | S$8,166 psm | S$787,388 | 228 | 66 |
The town's per-square-metre median is 25.7% above where this series begins
Stretch the view back and the shape changes. Since 3Q2024, the town's median psm has moved +25.7%, from S$6,496 psm on 225 sales. The climb was not a straight line. The median ran S$7,973 psm in both 2Q2025 and 3Q2025, then eased to S$7,637 psm in 4Q2025, then S$7,714 psm in 1Q2026, before the latest reading of S$8,166 psm. That is a flat stretch, a dip and a fresh high across two years.
Quarterly counts sit close together for most of the run. They range from 181 sales in 4Q2024 to 283 in 3Q2025. That matters because a thin quarter makes a median jumpier. None of these quarters is thin by town standards. What the chart below does not show is the mix behind each point, or how many of the flats were newly past their minimum occupation period. The line plots the middle of the market, quarter by quarter, and nothing more.
Not every flat type in Toa Payoh moved in the same direction
Split the quarter by flat type and the town splits three ways. Three-room flats posted a median of S$376,944, down 8.1% from S$410,000 in 2Q2025, on 108 sales. Four-room flats came in at S$1,021,000, up 1.2% from S$1,008,888, on 86 sales. Five-room flats reached S$1,043,400, up 5.9% from S$985,000, on 28 sales. So the largest fall and the largest rise sit in the same town, in the same three months.
The per-square-metre column is where it gets interesting. Four-room flats show a median of S$11,162 psm, above the five-room median of S$8,664 psm. Three-room flats sit at S$5,675 psm. A higher psm on a smaller flat type is common enough, since price does not scale evenly with area. But it also tells you why a town-wide psm median and a town-wide price median can drift apart.
One limit on the five-room line: 28 sales is a small base. A handful of high-floor or newer units can move that median on its own. The three-room figure rests on 108 sales, the broadest of the three.
| Flat type | Median price Q2 2026 | Median psm | Sales | Median price Q2 2025 | Change |
|---|---|---|---|---|---|
| Toa Payoh 3-room | S$376,944 | S$5,675 psm | 108 | S$410,000 | -8.1% |
| Toa Payoh 4-room | S$1,021,000 | S$11,162 psm | 86 | S$1,008,888 | +1.2% |
| Toa Payoh 5-room | S$1,043,400 | S$8,664 psm | 28 | S$985,000 | +5.9% |
All five of the quarter's highest prices were five-room flats, and four sat on Lor 1a
The top of the quarter is narrow. The highest recorded price in Toa Payoh was S$1,580,000 for a five-room flat at Blk 139B Lor 1a Toa Payoh. It spans 114 sqm on the 37 TO 39 storey range, works out to S$13,860 psm, and has 85 years of lease left. Two more five-room flats matched at S$1,430,000, one at Blk 139A Lor 1a and one at Blk 138C Lor 1a, both at S$12,222 psm.
The one address outside that cluster is Blk 105B Bidadari Pk Dr, at S$1,380,000 and S$12,105 psm, with 93 years of lease remaining. It also traded from the 04 TO 06 storey range, the lowest band in the table below. The fifth entry returns to Blk 138C Lor 1a at S$1,340,000.
Five records cannot describe a 228-sale quarter. They do show where the ceiling sat, and that the ceiling was made up entirely of five-room units with 85 years or more of lease left.
| Block | Flat type | Storey range | Area | Price | Per sqm | Lease left (years) |
|---|---|---|---|---|---|---|
| Blk 139B Lor 1a Toa Payoh | 5-room | 37 TO 39 | 114 sqm | S$1,580,000 | S$13,860 psm | 85 |
| Blk 139A Lor 1a Toa Payoh | 5-room | 22 TO 24 | 117 sqm | S$1,430,000 | S$12,222 psm | 85 |
| Blk 138C Lor 1a Toa Payoh | 5-room | 28 TO 30 | 117 sqm | S$1,430,000 | S$12,222 psm | 85 |
| Blk 105B Bidadari Pk Dr | 5-room | 04 TO 06 | 114 sqm | S$1,380,000 | S$12,105 psm | 93 |
| Blk 138C Lor 1a Toa Payoh | 5-room | 10 TO 12 | 110 sqm | S$1,340,000 | S$12,182 psm | 85 |
Two things stay open in this data. First, how much of the gap between a rising psm median and a falling price median comes down to mix, since the records show transacted prices rather than the make-up of each quarter. Second, whether the drop in million-dollar deals, from 80 a year earlier to 66, holds or reverses once the next set of resale records lands. The three-room line, on the broadest base of the three flat types, is the other one to track in 3Q2026.
A single town median rarely carries a quarter on its own. Toa Payoh's per-square-metre figure and its price figure disagreed this quarter, and both were accurate. The value sits in reading them together, across eight quarters, against the island-wide number, and with the flat-type split in view. That is the frame we keep coming back to.
Method: HDB resale records grouped by town and by the quarter of the sale month. Medians are of price and of price per square metre. Flat types with fewer than five sales in the quarter are omitted from the breakdown. Lease left is rounded to whole years as at the sale. Private figures are from URA Data Service caveats, HDB figures from data.gov.sg resale records, both loaded weekly by this site's ingest. Medians are of the non-excluded transactions in the period named. Sales flagged by the hygiene rules (related-party transfers, bulk deals, outliers) are left out. Every figure is indicative and drawn from recorded transactions, not a formal valuation.