The Trilinq Logged 40 Resales At A Median Of S$1,830 psf — But Its Biggest-Ticket Sale Was One Of Its Lowest Per Square Foot
Published 13 Oct 2026 · The Trilinq
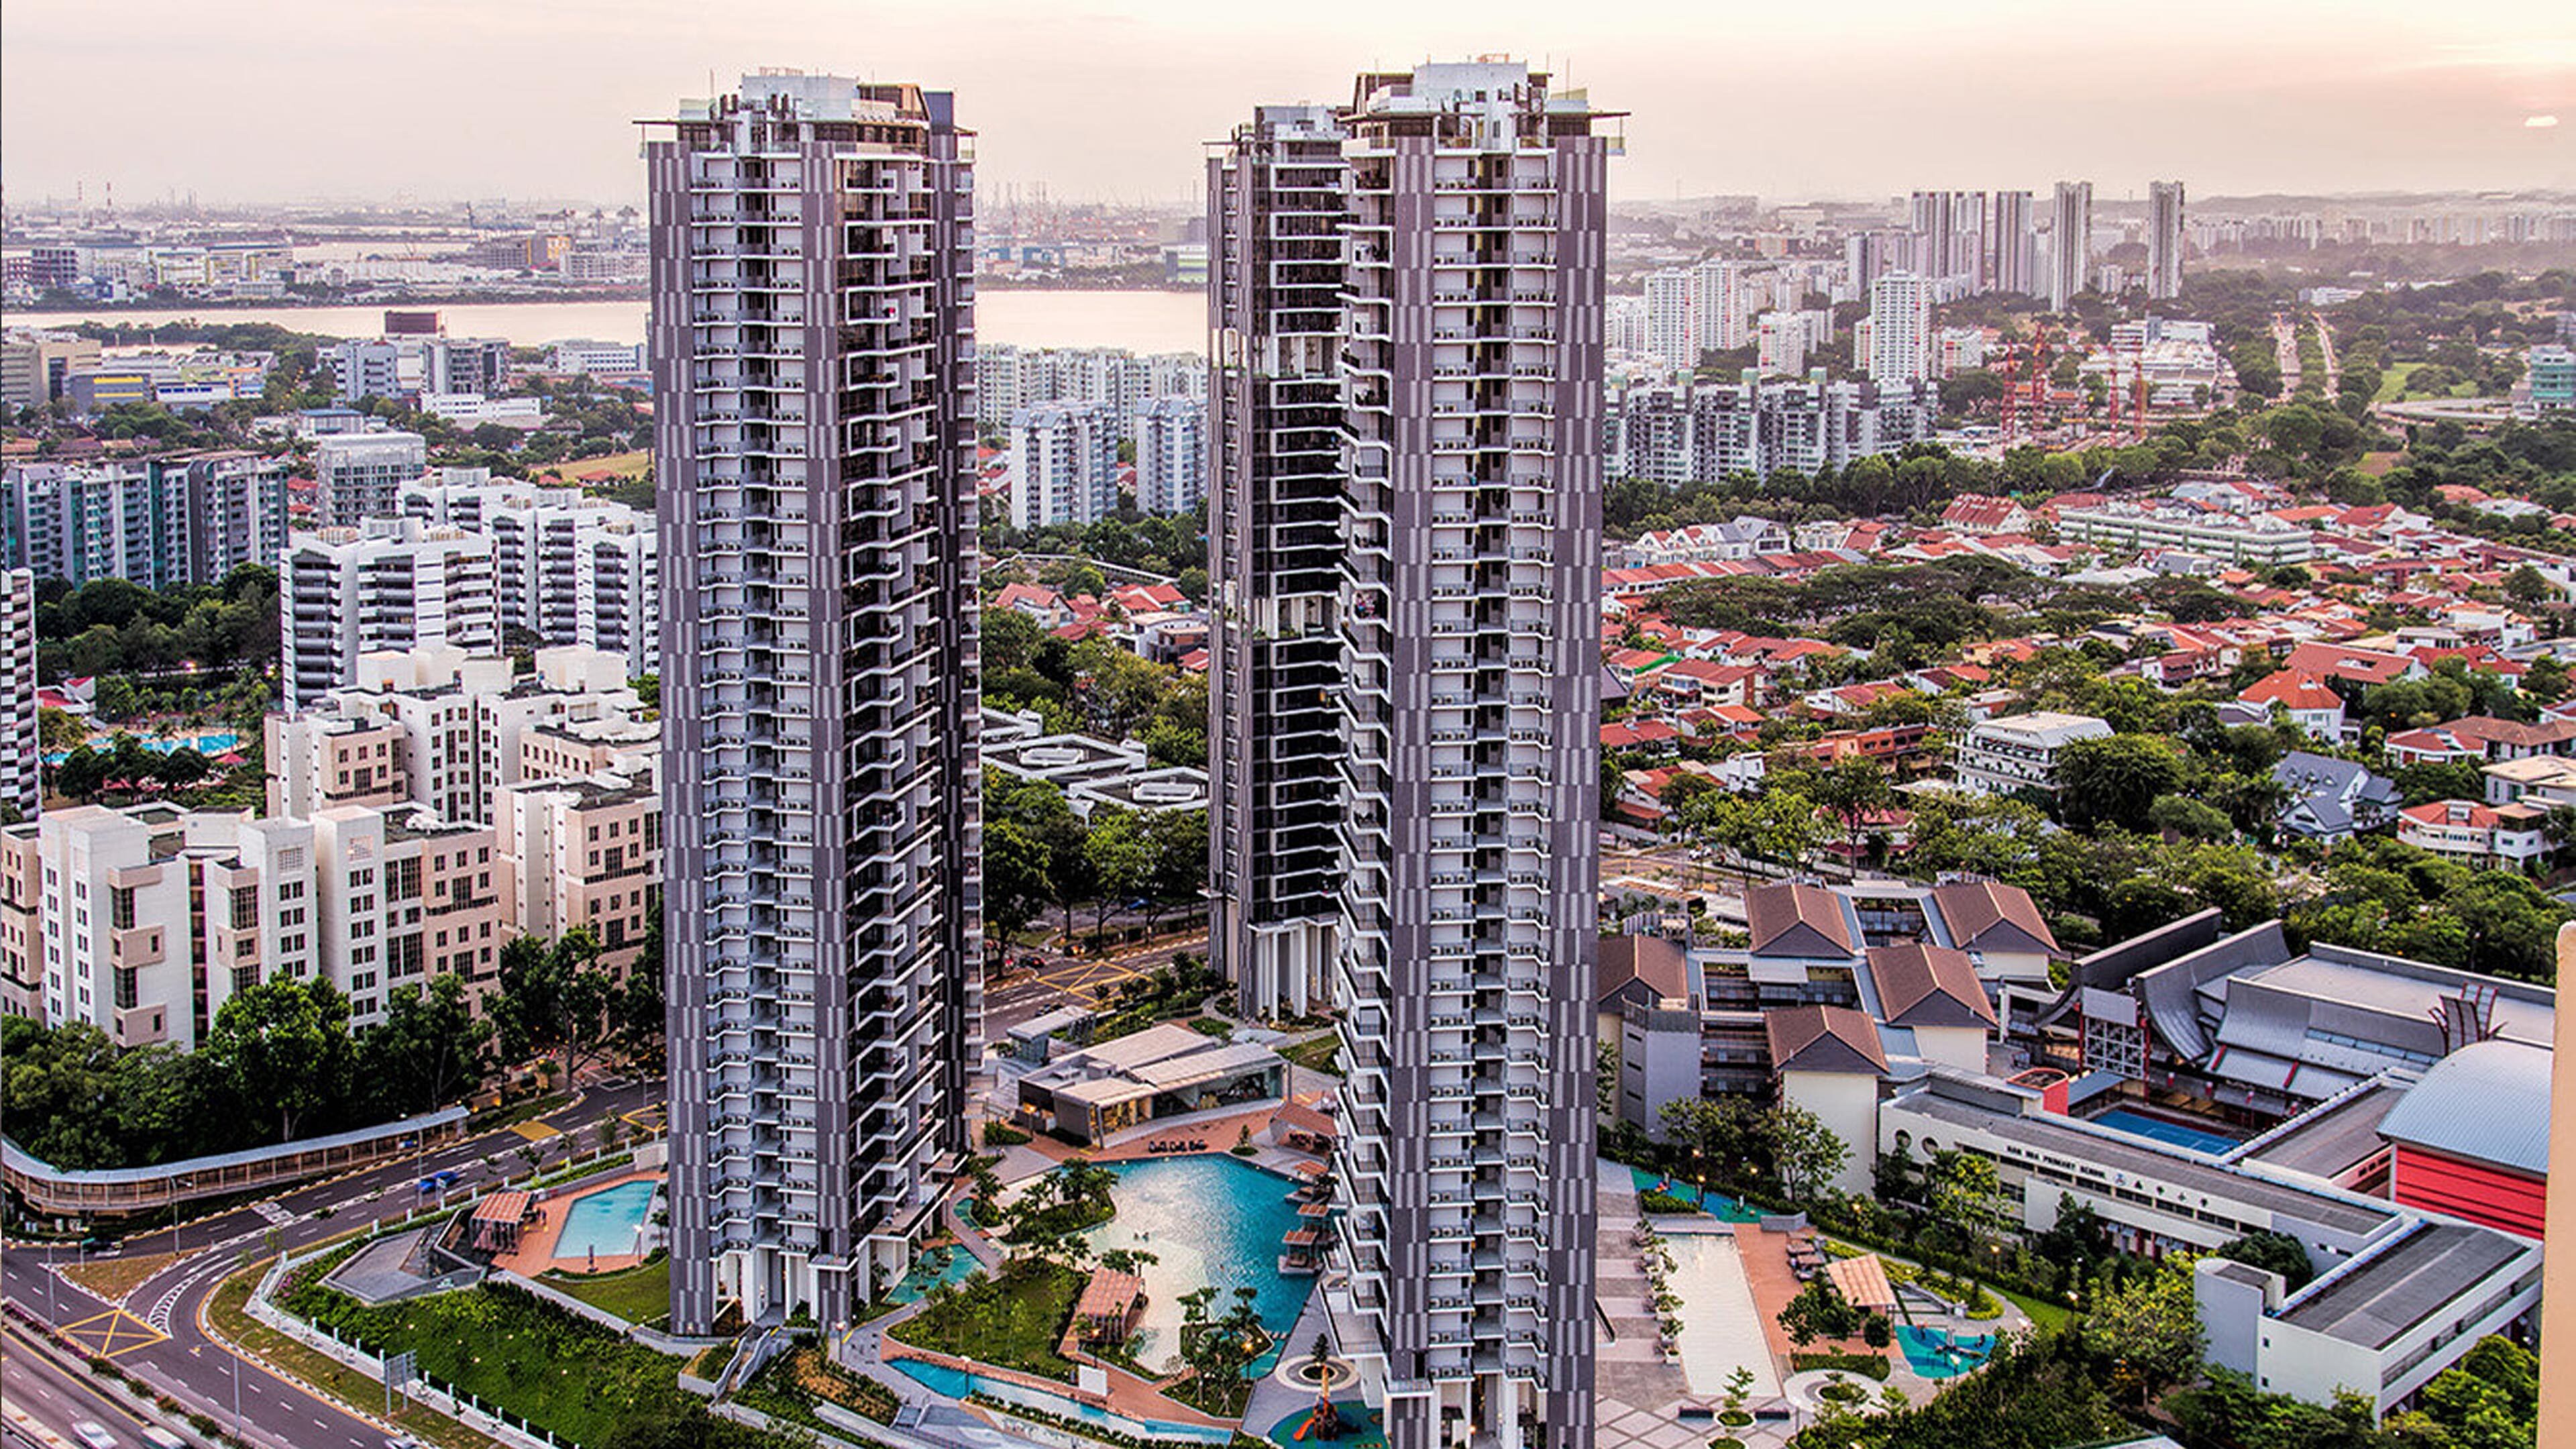
A project median tells you one thing. The sales behind it often tell you another. At The Trilinq, the two pull in different directions, and the gap sits mostly in unit size and floor level rather than in time.
According to URA Data Service caveats, The Trilinq recorded 40 resales over 3Q2025 to 2Q2026 at a median of S$1,830 psf. It is a 99-year leasehold condo in District 5 with 85 years of lease left. Over the eight quarters we pulled, the quarterly median moved +5.6%, from S$1,739 psf in 3Q2024 on 13 sales to S$1,836 psf in 2Q2026 on seven. Over the same four-quarter window, the district median was S$1,858 psf from 743 sales, which puts the project -1.5% against it. Here is what stood out to us when we went through the tables.
The quarterly median has moved inside a narrow band for two years
The eight-quarter series does not show a trend so much as a range. The low point is 3Q2024 at S$1,739 psf. The high point is 1Q2025 at S$1,896 psf. Everything else sits between those two. The most recent reading, 2Q2026, is S$1,836 psf on seven sales. That is the thinnest quarter in the series, so the median there rests on very few caveats.
What moves more than the median is the spread around it. In 4Q2024, the 25th and 75th percentiles were S$1,819 psf and S$1,957 psf. By 2Q2026, they were S$1,760 psf and S$2,105 psf. The middle held, but the edges pulled apart. That pattern usually points to a change in what is transacting rather than a change in price for a like-for-like unit. The size table in the next section gives a sense of why.
The quarterly median and the sale counts behind it are below.
| Quarter | Resales | Median psf | 25th percentile | 75th percentile |
|---|---|---|---|---|
| Q3 2024 | 13 | S$1,739 psf | S$1,654 psf | S$1,872 psf |
| Q4 2024 | 8 | S$1,863 psf | S$1,819 psf | S$1,957 psf |
| Q1 2025 | 9 | S$1,896 psf | S$1,812 psf | S$1,948 psf |
| Q2 2025 | 11 | S$1,776 psf | S$1,746 psf | S$1,865 psf |
| Q3 2025 | 9 | S$1,844 psf | S$1,624 psf | S$1,858 psf |
| Q4 2025 | 13 | S$1,830 psf | S$1,698 psf | S$1,898 psf |
| Q1 2026 | 11 | S$1,855 psf | S$1,680 psf | S$1,998 psf |
| Q2 2026 | 7 | S$1,836 psf | S$1,760 psf | S$2,105 psf |
Not every size band at The Trilinq is pricing the same way
The four size bands in the window produce four quite different per-square-foot medians. The 70 to 89 sqm band is the highest at S$2,033 psf, on 10 resales with a median area of 915 sqft and a median price of S$1,860,000. The 90 to 119 sqm band was the most traded, with 12 resales, but its median psf is S$1,615. Its median price, S$1,790,000, is lower than the smaller band's despite a median area of 1,109 sqft.
The largest band tells a similar story. Units of 120 sqm and above transacted at a median of S$2,380,000, or S$1,732 psf, across nine resales. The smallest band, 50 to 69 sqm, sat at S$1,844 psf with a median price of S$1,310,000.
So the project median of S$1,830 psf sits between bands that are several hundred dollars psf apart. Shift the quarter's mix towards larger units and the headline falls without any single unit repricing. The table below is the one to read alongside the quarterly series.
| Size band | Resales | Median area | Median price | Median psf |
|---|---|---|---|---|
| 50 to 69 sqm | 9 | 710 sqft | S$1,310,000 | S$1,844 psf |
| 70 to 89 sqm | 10 | 915 sqft | S$1,860,000 | S$2,033 psf |
| 90 to 119 sqm | 12 | 1,109 sqft | S$1,790,000 | S$1,615 psf |
| 120 sqm and above | 9 | 1,356 sqft | S$2,380,000 | S$1,732 psf |
Rents per square foot have edged up while contract counts have fallen
The rental side is a larger sample than the resale side. URA rental contracts at The Trilinq ran at 66 in 3Q2025, 33 in 4Q2025, 43 in 1Q2026 and 30 in 2Q2026. Across those four quarters, the median rent per square foot a month went 5.6, 5.6, 5.7 and 5.9.
Median monthly rent did not follow the same path. It was S$4,250 in 3Q2025, then S$4,200, then S$4,100, then back to S$4,200 in 2Q2026. A rising psf figure with a flat dollar rent is consistent with smaller units making up more of the leasing mix. The tables here cannot separate that from an underlying move in rent, so we would not read too much into one quarter either way.
Against the resale median, our engine puts the 2Q2026 position at a gross yield of about 3.7%. That is a measured figure from recorded transactions and approvals, not a valuation of any home. The quarterly rental record is below.
| Quarter | Contracts | Median rent (S$ psf a month) | Median monthly rent |
|---|---|---|---|
| Q3 2025 | 66 | 5.6 | S$4,250 |
| Q4 2025 | 33 | 5.6 | S$4,200 |
| Q1 2026 | 43 | 5.7 | S$4,100 |
| Q2 2026 | 30 | 5.9 | S$4,200 |
Within 1 km, the project sits below the larger and newer neighbours
Parc Clematis, 300 m away, was the busiest project in the radius with 75 resales at a median of S$2,255 psf. Whistler Grand, at 764 m, recorded 55 resales at S$1,941 psf. Twin Vew came in at S$1,884 psf on 29 resales, and Hundred Trees at S$1,873 psf on 11.
Below The Trilinq's own median are Parc Riviera at S$1,757 psf on 37 resales and Newest at S$1,576 psf on nine. The Parc Condominium, the only freehold entry in the list, posted S$1,978 psf from 14 resales. Tenure, age and unit mix all differ across these projects, and the table holds none of that constant.
That is also the context for the -1.5% gap to the District 5 median of S$1,858 psf. The district figure covers 743 sales across a far wider spread of projects than this 1 km list. The neighbour table is below.
| Project | Tenure | TOP | Distance | Resales | Median psf |
|---|---|---|---|---|---|
| Parc Clematis | 99-year leasehold | — | 300 m | 75 | S$2,255 psf |
| Whistler Grand | 99-year leasehold | — | 764 m | 55 | S$1,941 psf |
| Parc Riviera | 99-year leasehold | — | 900 m | 37 | S$1,757 psf |
| Twin Vew | 99-year leasehold | — | 945 m | 29 | S$1,884 psf |
| Botannia | 956-year leasehold | — | 724 m | 19 | S$1,795 psf |
| The Parc Condominium | freehold | — | 880 m | 14 | S$1,978 psf |
| Hundred Trees | 956-year leasehold | — | 538 m | 11 | S$1,873 psf |
| Newest | 956-year leasehold | — | 478 m | 9 | S$1,576 psf |
The largest cheques in the window came from the lowest floors
The highest resale price over the four quarters was S$2,800,000 in 4Q2025. That was a 1,765 sqft unit in the 01-05 storey range, which works out in the caveat to S$1,586 psf. The second-highest, S$2,500,000 in 3Q2025, was also a ground-band unit of 1,604 sqft at S$1,559 psf.
Both sit well below the project's four-quarter median per square foot. The high-floor entries in the same table do the opposite. A 1,356 sqft unit on the 26-30 band went for S$2,490,000, or S$1,836 psf. A same-sized unit on 31-35 went for S$2,430,000 at S$1,792 psf, and a 1,345 sqft unit on 31-35 fetched S$2,380,000 at S$1,769 psf.
Large, low-floor units moving at the top of the price table is exactly the kind of mix that widens the quartile spread we saw earlier. Five transactions cannot settle it, but the direction is consistent. The top five prices are below.
| Quarter | Storey range | Area | Price | Per sqft |
|---|---|---|---|---|
| Q4 2025 | 01-05 | 1,765 sqft | S$2,800,000 | S$1,586 psf |
| Q3 2025 | 01-05 | 1,604 sqft | S$2,500,000 | S$1,559 psf |
| Q2 2026 | 26-30 | 1,356 sqft | S$2,490,000 | S$1,836 psf |
| Q2 2026 | 31-35 | 1,356 sqft | S$2,430,000 | S$1,792 psf |
| Q4 2025 | 31-35 | 1,345 sqft | S$2,380,000 | S$1,769 psf |
We have tested our own estimate at this project, and the error is on record
One number we can show is how our estimate has held up here. Tested against 36 later sales at The Trilinq as of 4Q2025, it had a median error of 3.5%, with 39% of those sales falling inside the stated range. That second figure is the one worth sitting with. More than half the sales landed outside the range we published.
A 3.5% median error on a project with bands running from S$1,615 psf to S$2,033 psf is the kind of accuracy that comes with a caveat attached to it. Every figure in this piece is indicative and drawn from recorded transactions and rental approvals. None of it is a valuation of a specific home, and the per-square-foot numbers here are all private-market psf, not HDB psm.
In pictures
The data leaves a few things open. Whether the 2Q2026 median of S$1,836 psf holds depends partly on what sizes transact next, since seven sales is a thin base. The widening gap between the 25th and 75th percentiles is worth tracking in the next quarter's caveats, as is whether the rental psf keeps climbing while the dollar rent stays near S$4,200. The size-band table would also look different if the 90 to 119 sqm group stopped being the most traded.
A single quarter's median at one project rarely carries much on its own. What it is worth comes from the frame around it: eight quarters of the same series, the bands underneath, the district it sits in, and the eight projects within a kilometre. Read that way, The Trilinq's numbers look less like a line moving and more like a mix shifting.
Method: URA resale caveats at the project (developer sales and sub-sales excluded) by the quarter of the sale month. Size bands by caveated floor area. Rents are URA rental contracts at the project, and the gross yield is the mean of the quarterly median rents per square foot, annualised, over the four-quarter resale median per square foot, before any cost. Lease left is the tenure less the years since the lease started, as recorded. The estimate accuracy is this site's backtest: the engine run as of the quarter named, compared with the sales since. Private figures are from URA Data Service caveats, HDB figures from data.gov.sg resale records, both loaded weekly by this site's ingest. Medians are of the non-excluded transactions in the period named. Sales flagged by the hygiene rules (related-party transfers, bulk deals, outliers) are left out. Every figure is indicative and drawn from recorded transactions, not a formal valuation.