One Marina Gardens Has Sold 567 Of 937 Units — But Only 29 Of Them In The Last Three Months
Published 22 Oct 2026 · One Marina Gardens
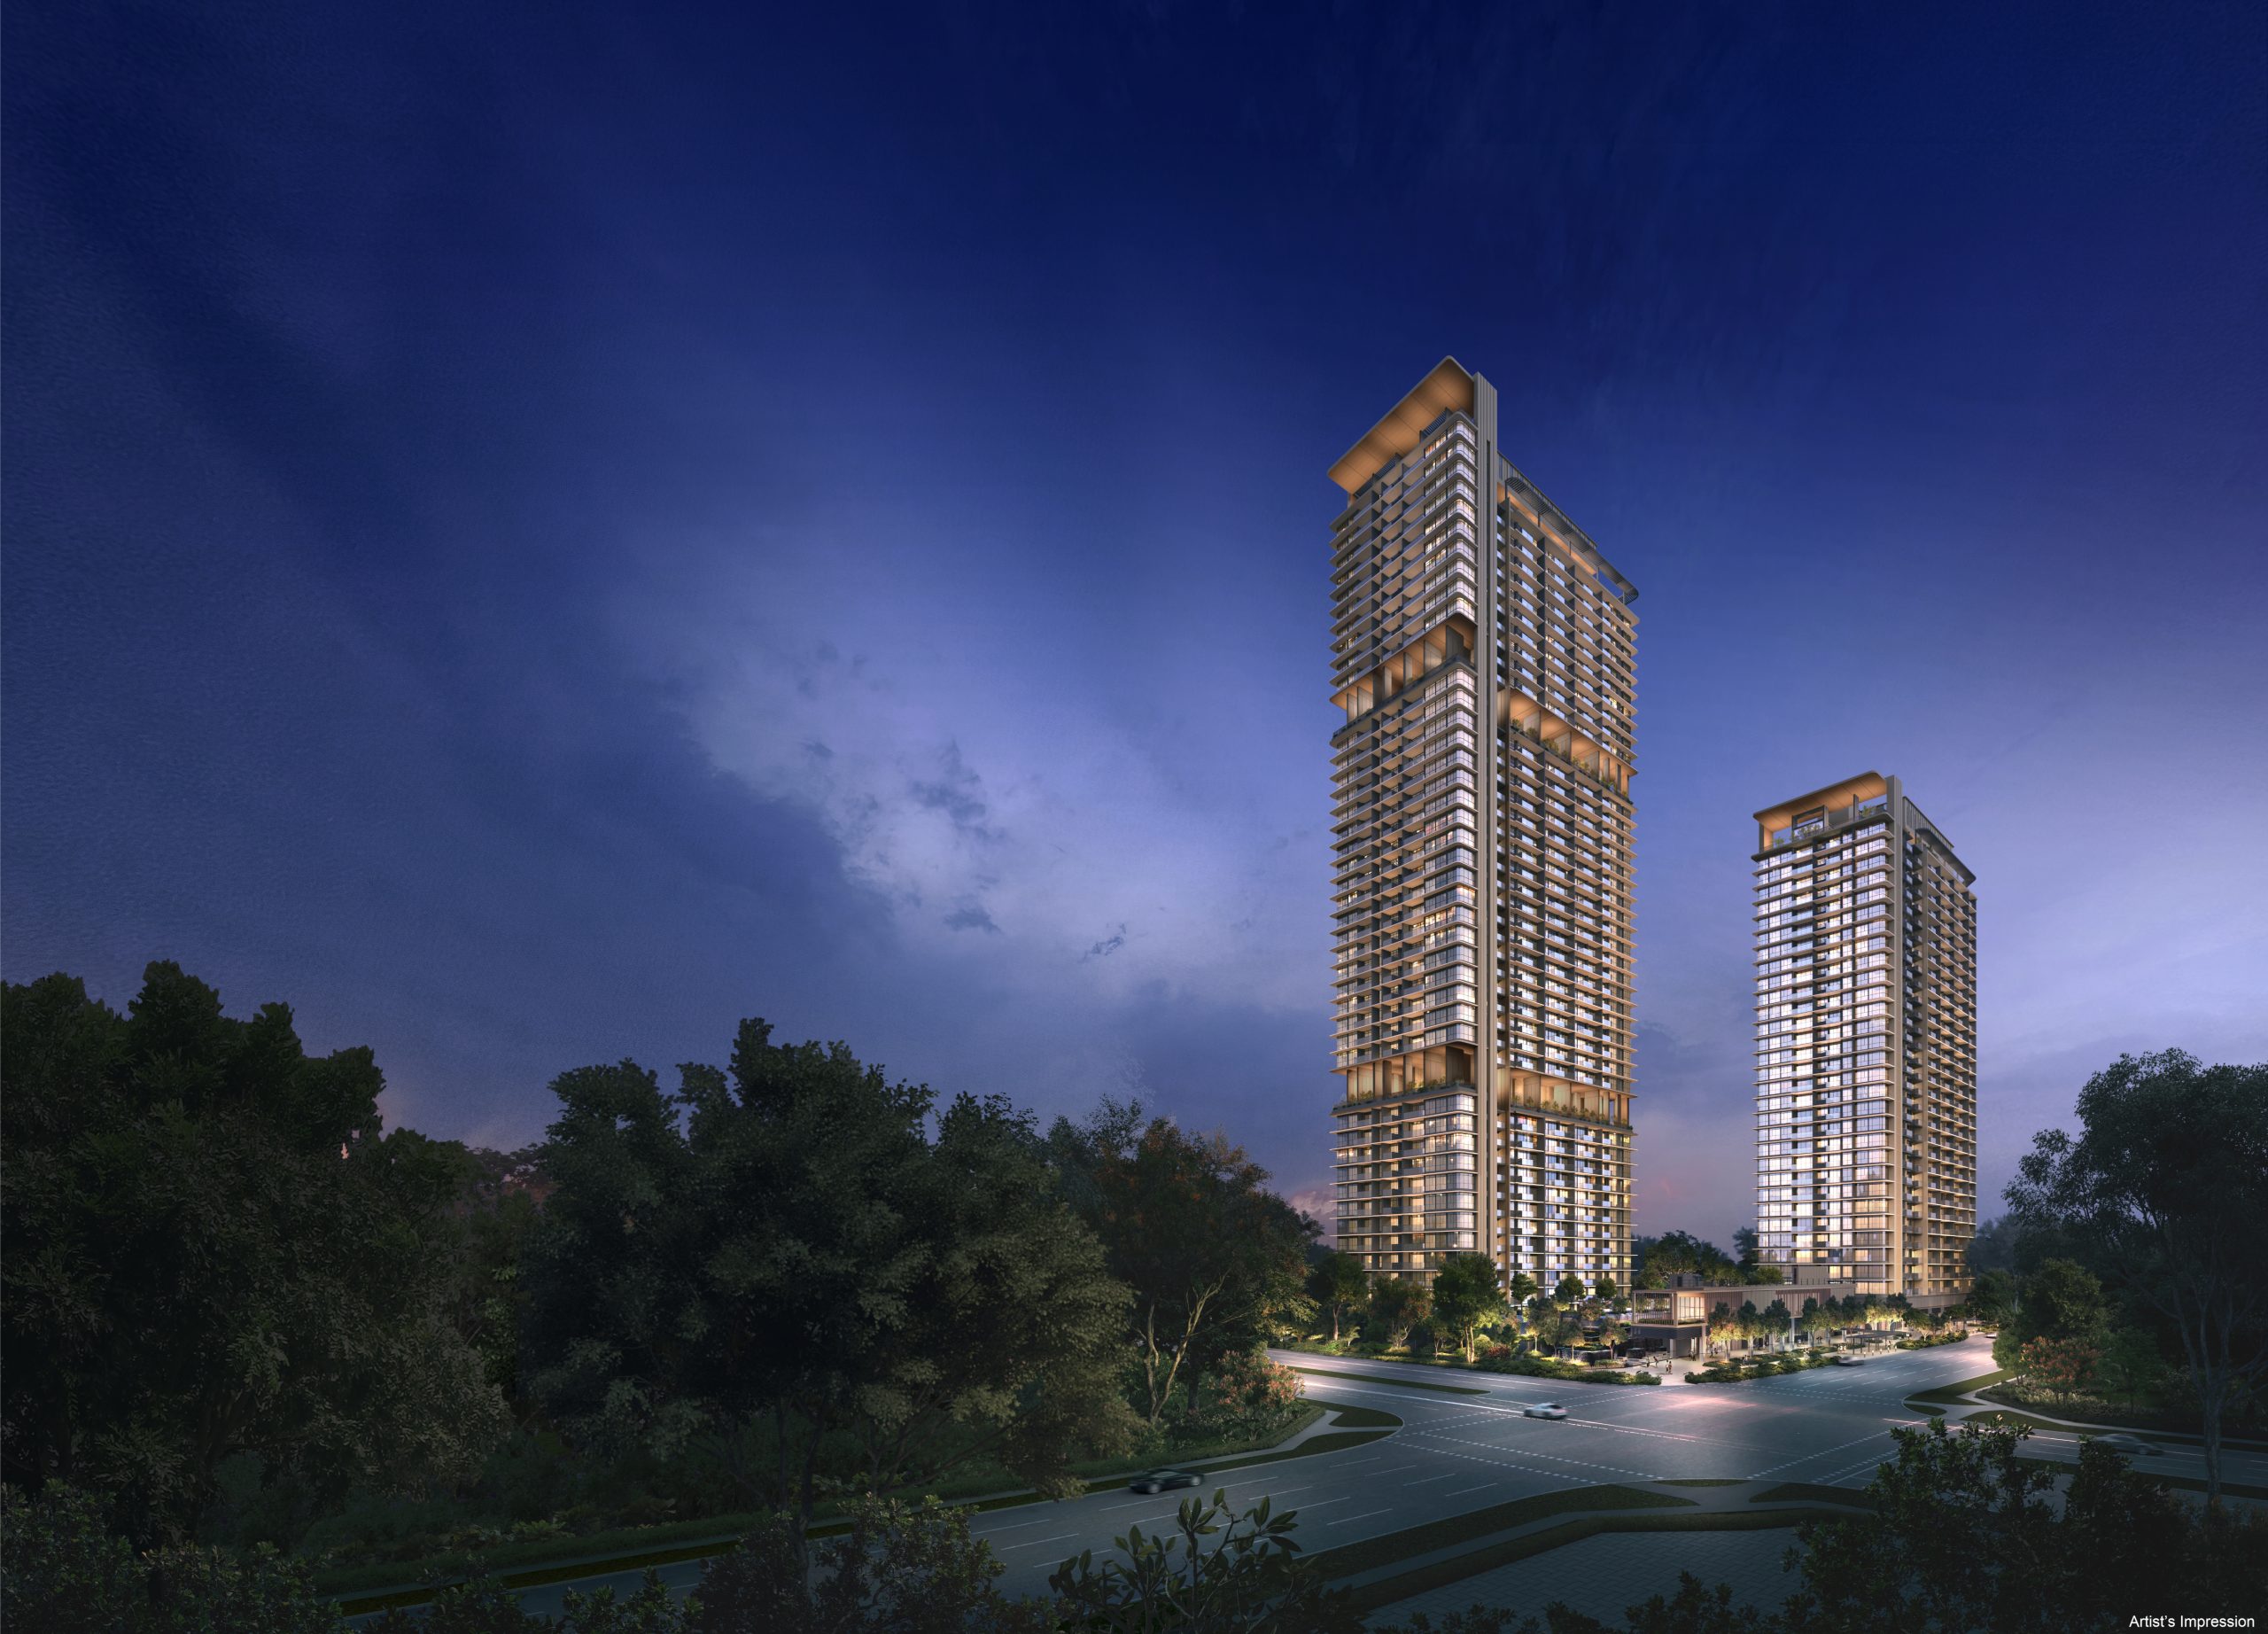
A single launch month can carry a project for a very long time. One Marina Gardens is a clear example of that. Most of its sales landed in one burst, and the pace since has been slow. What makes it worth a closer look is that the pricing did not follow the volume down. The monthly median psf is higher now than it was at launch, even in months with only a handful of caveats. We pulled the month-by-month record, the size bands, the nearby resales and the district's other launches to see how those pieces line up.
According to URA Data Service caveats, One Marina Gardens has recorded 567 developer sales since April 2025. That is 60.5% of its 937 units. Twenty-nine of those came in the three months to September 2026, and seven in September itself. The overall median across the whole run is S$2,968 psf. The project sits in District 1 on a 99-year lease, and the developer is Kingsford Development, per the developer's website. Here is what stood out to us when we worked through the tables.
April 2025 did almost all of the work, and every month since has been far thinner
The shape of the sales run is lopsided. April 2025 brought 295 caveats. May 2025 followed with 57, then 44 in June and 20 in July. From August 2025 the monthly counts drop into single digits and low teens. August 2025 recorded 8, September 2025 recorded 7, and October 2025 recorded 6. The cumulative column tells the same story from the other side. By July 2025 the project had already reached 416 sales. It took the next fourteen months to add the rest.
2026 has not been flat, though. April 2026 recorded 24 caveats and May 2026 recorded 18. June 2026 then dropped to 4, before July 2026 picked back up to 17. August 2026 recorded 5 and September 2026 recorded 7. That is a pattern of small, uneven bursts rather than a steady monthly run rate.
One thing the chart cannot settle is what sits behind each month. A month with four or five caveats is a very small sample. Timing of caveat lodgement can also shift a sale from one month to the next. The chart below shows the monthly counts in full.
The median psf has moved up 4.2% since the first month of sales
The pricing column runs in the other direction from the volume. The first month, April 2025, had a median of S$2,957 psf. September 2026 came in at S$3,082 psf. That is a move of +4.2% from the first month to the latest one. August 2026 also printed S$3,082 psf, the joint highest in the run.
The path there was not a straight line. The softest readings came in late 2025. August 2025 showed S$2,894 psf and September 2025 showed S$2,894 psf and S$2,918 psf across that stretch, with October 2025 back at S$2,960 psf. November 2025 then reached S$3,019 psf and December 2025 S$3,047 psf, both on fewer than twenty caveats each.
That is the main caution with this column. In thin months, the median reflects whichever few units happened to transact. A month of large high-floor units and a month of compact ones will not read the same, even at unchanged pricing. The table below sets the monthly counts and medians side by side.
| Month | Caveats | Cumulative | Median psf |
|---|---|---|---|
| April 2025 | 295 | 295 | S$2,957 psf |
| May 2025 | 57 | 352 | S$2,974 psf |
| June 2025 | 44 | 396 | S$2,962 psf |
| July 2025 | 20 | 416 | S$2,965 psf |
| August 2025 | 8 | 424 | S$2,918 psf |
| September 2025 | 7 | 431 | S$2,894 psf |
| October 2025 | 6 | 437 | S$2,960 psf |
| November 2025 | 16 | 453 | S$3,019 psf |
| December 2025 | 5 | 458 | S$3,047 psf |
| January 2026 | 12 | 470 | S$2,999 psf |
| February 2026 | 11 | 481 | S$2,989 psf |
| March 2026 | 11 | 492 | S$2,933 psf |
| April 2026 | 24 | 516 | S$2,979 psf |
| May 2026 | 18 | 534 | S$2,975 psf |
| June 2026 | 4 | 538 | S$2,990 psf |
| July 2026 | 17 | 555 | S$3,028 psf |
| August 2026 | 5 | 560 | S$3,082 psf |
| September 2026 | 7 | 567 | S$3,082 psf |
The 50 to 69 sqm band accounts for 265 of the 567 sales
By size, the project's sales are concentrated in the smaller bands. The 50 to 69 sqm band recorded 265 caveats. Its median area is 678 sqft, with a median price of S$2,052,132, or S$2,994 psf. The under 50 sqm band follows with 170 caveats, at a median of S$1,251,825 (S$2,943 psf) on 431 sqft. Together those two bands make up the bulk of the run.
The larger bands are much thinner. The 90 to 119 sqm band recorded 96 caveats, at a median of S$3,059,738 (S$2,961 psf). The 70 to 89 sqm band has only 20 caveats, and the 120 sqm and above band only 16. The largest band shows a median price of S$4,962,769 on a median area of 1,647 sqft.
What strikes us is how narrow the psf range is across bands. The lowest band median is S$2,943 psf and the highest is S$3,013 psf. Price per square foot does not step up or down much with size here. The table below has the full breakdown.
| Size band | Caveats | Median area | Median price | Median psf |
|---|---|---|---|---|
| under 50 sqm | 170 | 431 sqft | S$1,251,825 | S$2,943 psf |
| 50 to 69 sqm | 265 | 678 sqft | S$2,052,132 | S$2,994 psf |
| 70 to 89 sqm | 20 | 904 sqft | S$2,672,292 | S$2,956 psf |
| 90 to 119 sqm | 96 | 1,012 sqft | S$3,059,738 | S$2,961 psf |
| 120 sqm and above | 16 | 1,647 sqft | S$4,962,769 | S$3,013 psf |
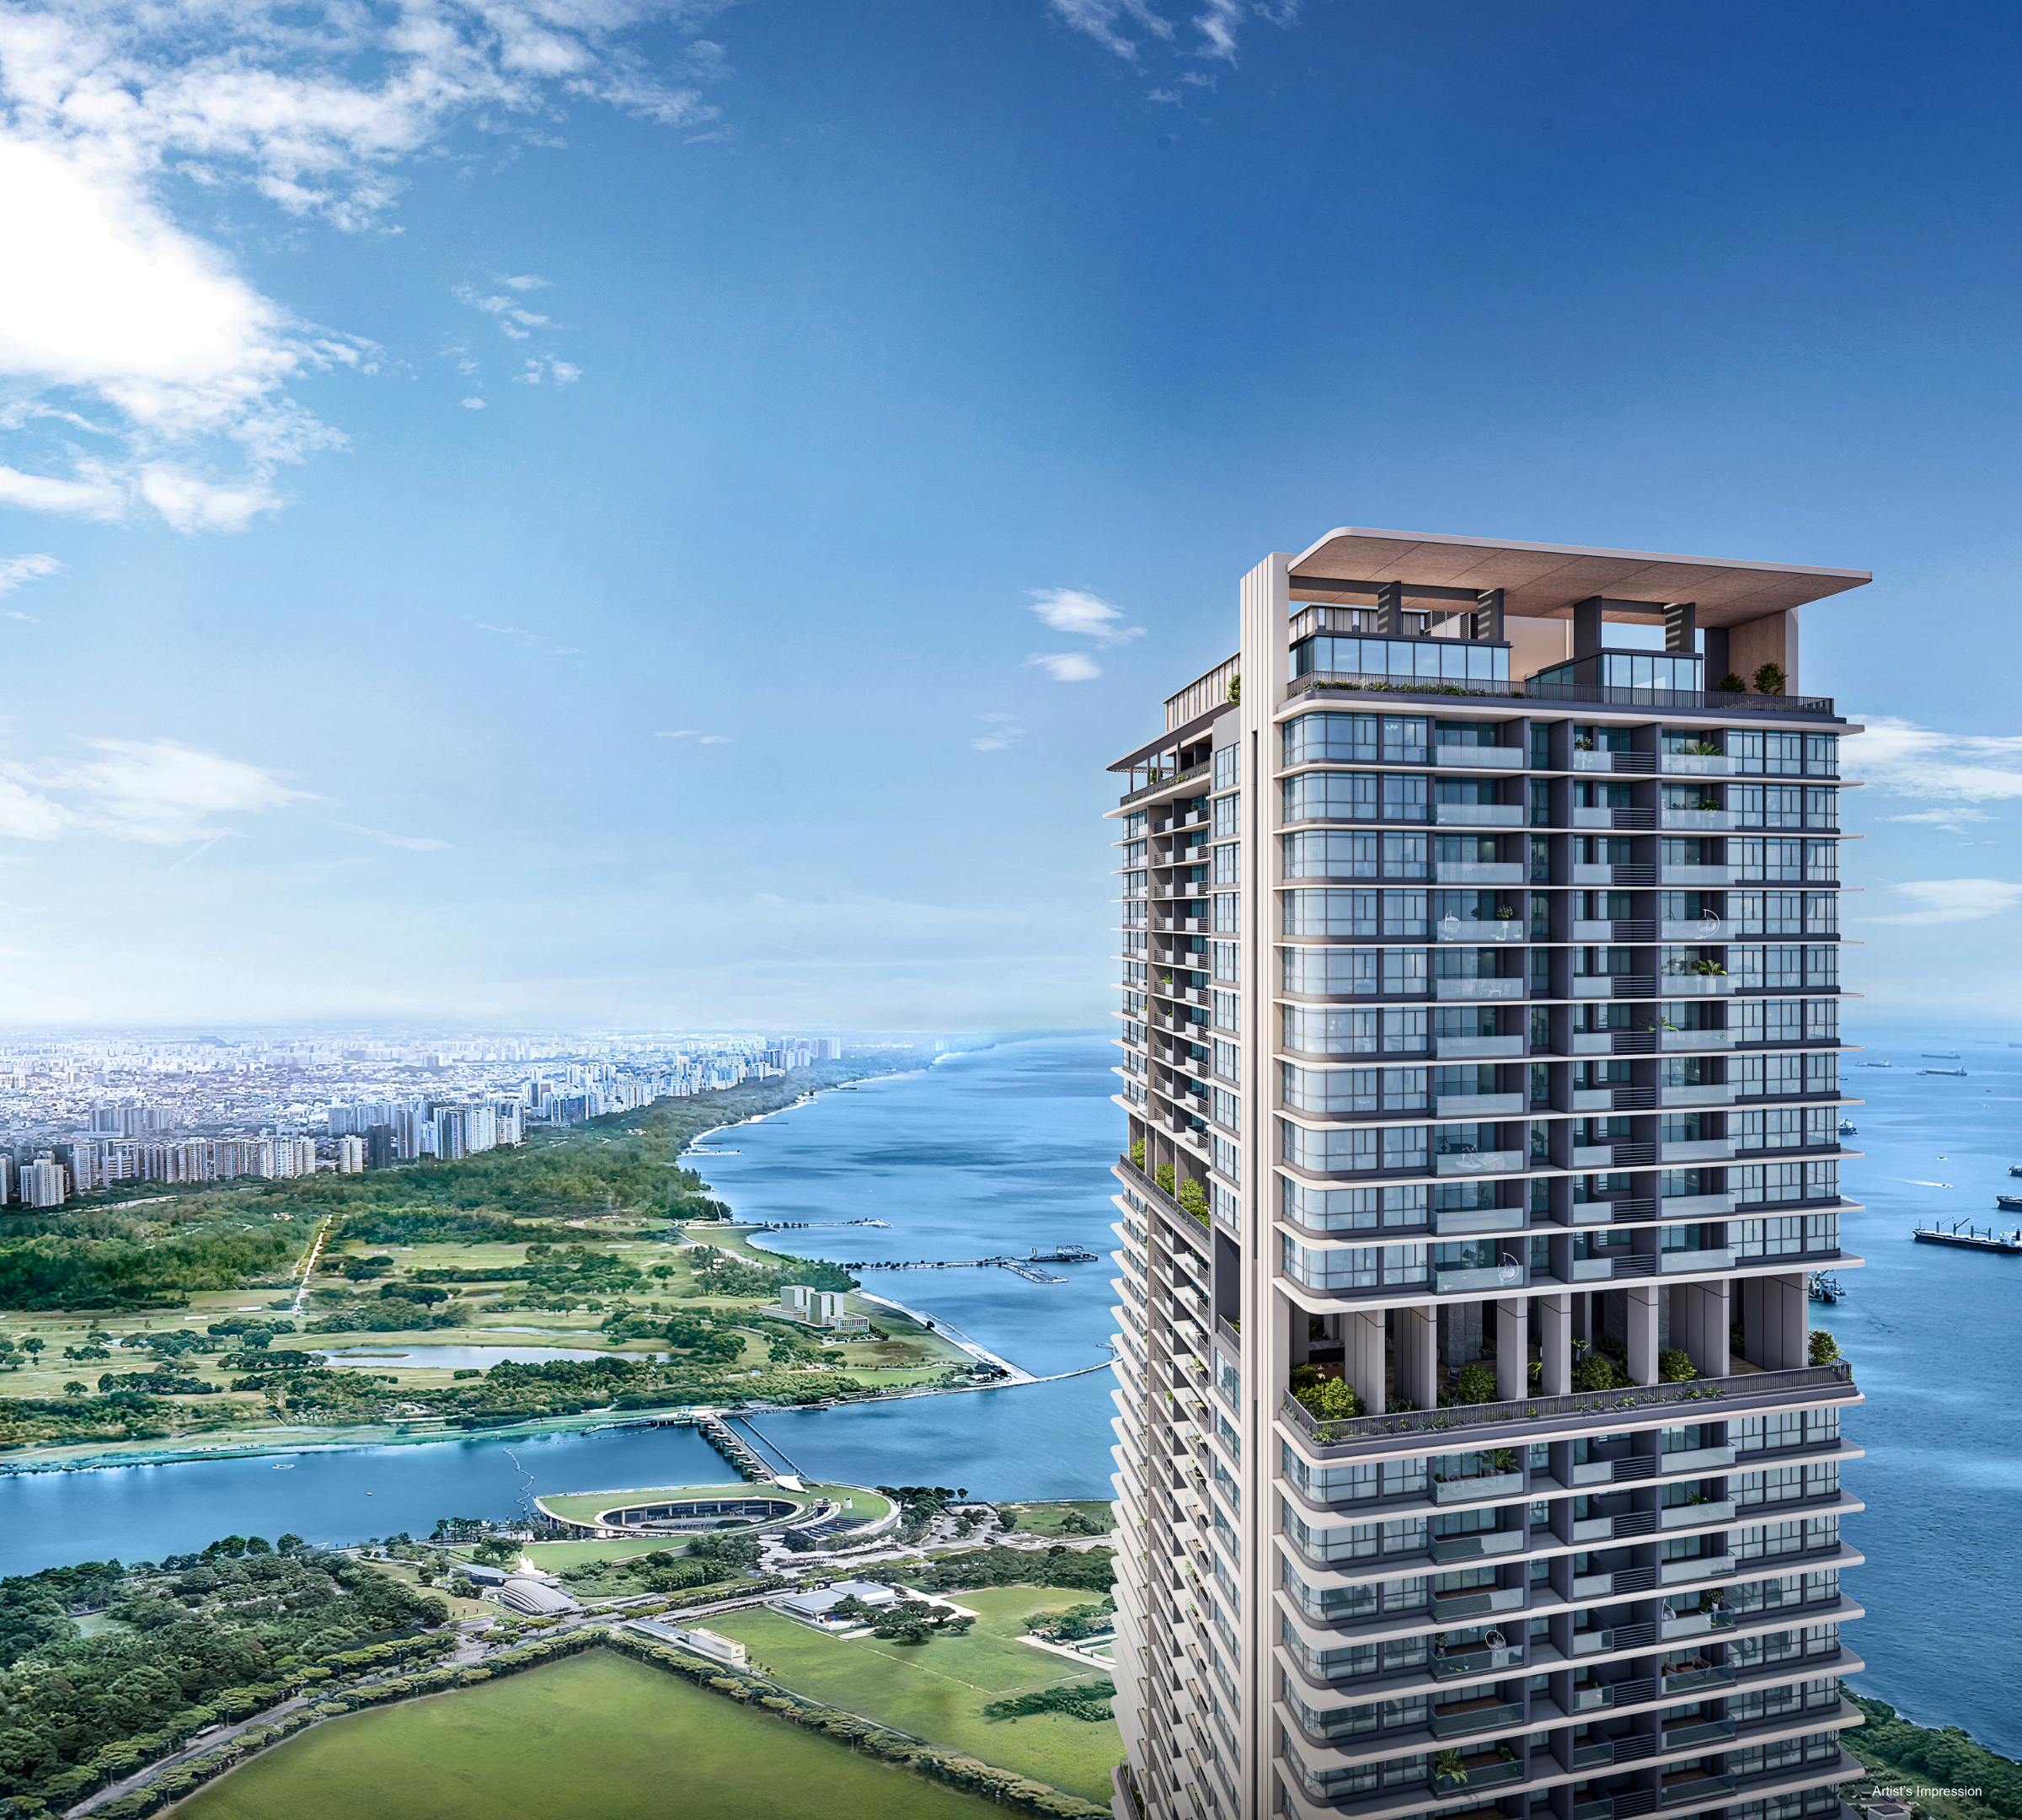
Only one completed project within a kilometre has resale records to compare against
For nearby context, we looked at resales within 1,000 m over the 24 months to September 2026. That search returns 32 resales across a single completed project. Marina Bay Residences, 981 m away and on a 99-year lease, accounts for all of them. Its median over that window is S$2,257 psf. The launch median sits +31.5% above that figure.
That gap needs reading with care. It compares new developer sales against resales in one older project, and the pool is 32 transactions. Age, layout mix and floor level all differ, and none of that is separated out in the table. This is a reference point from recorded caveats, not an assessment of either project.
It does tell you something about the immediate area, though. Within a kilometre, there is simply not much completed stock changing hands. The table below shows the full nearby resale picture.
| Project | Tenure | TOP | Distance | Resales | Median psf |
|---|---|---|---|---|---|
| Marina Bay Residences | 99-year leasehold | — | 981 m | 32 | S$2,257 psf |
Union Square Residences sold the most among District 1's other launches over the past year
The third comparison is against other launches in the same district. Over the 12 months to September 2026, Union Square Residences recorded 100 developer caveats at a median of S$2,802 psf. W Residences Marina View - Singapore recorded 13 caveats at S$2,660 psf. Skywaters Residences recorded 5 caveats at S$5,880 psf. All three are on 99-year leases.
Two of those counts are very small. Thirteen caveats and five caveats will not give a stable median. The S$5,880 psf figure in particular rests on five transactions, so it describes those five sales and little more. Volume in the district over the past year has been concentrated in Union Square Residences.
Set against that group, One Marina Gardens sits above Union Square Residences on median psf and well below Skywaters Residences. Its 29 sales in the three months to September 2026 are a separate measure from the 12-month counts in the table. The table below lists the district's other launches.
| Project | Tenure | Expected TOP | Caveats | Median psf |
|---|---|---|---|---|
| Union Square Residences | 99-year leasehold | — | 100 | S$2,802 psf |
| W Residences Marina View - Singapore | 99-year leasehold | — | 13 | S$2,660 psf |
| Skywaters Residences | 99-year leasehold | — | 5 | S$5,880 psf |
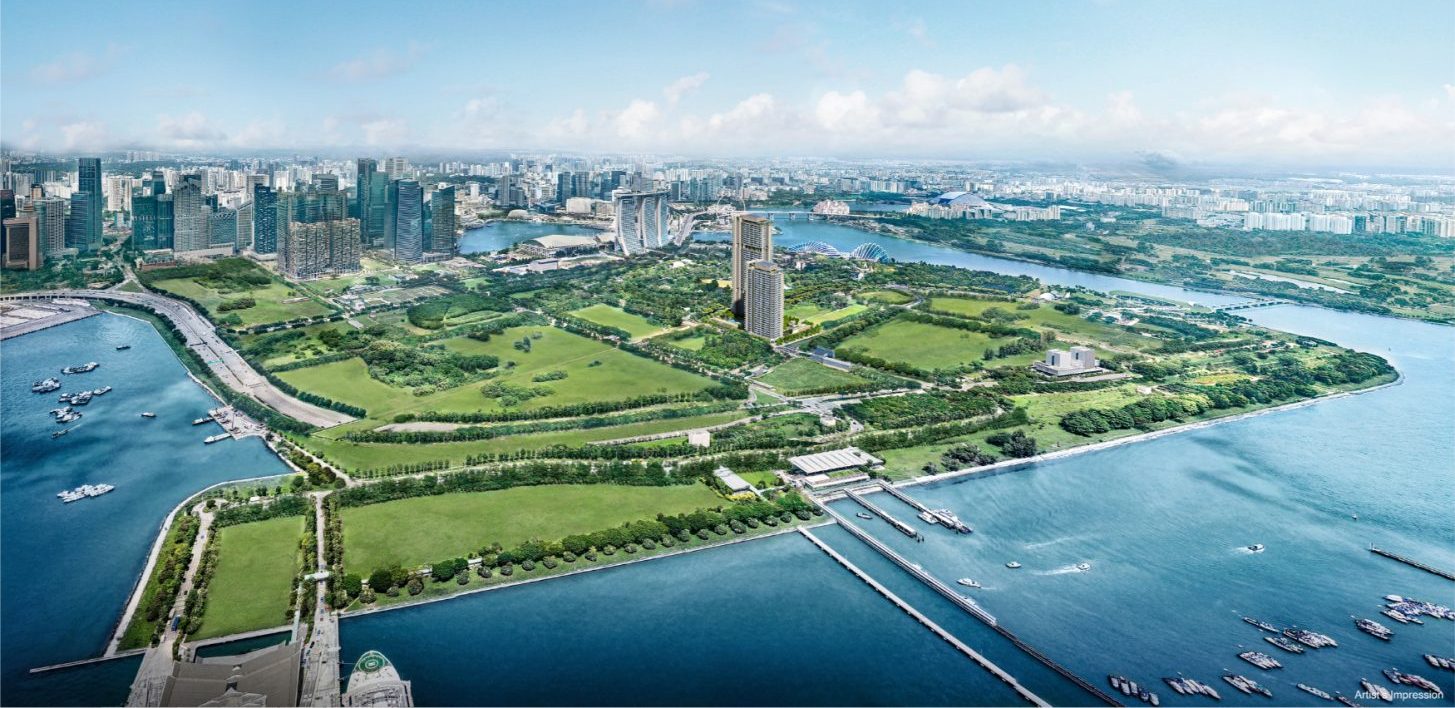
A few things the figures leave open. The monthly medians from mid-2025 onward rest on small counts. We cannot tell from caveats alone how much of each month's reading comes from unit mix. The nearby comparison rests on one project and 32 resales. And with 60.5% of the 937 units sold, the remaining stock could differ in size and floor from what has already moved. The next few months of caveats will show whether the S$3,082 psf readings in August and September 2026 hold, and whether the April and July 2026 bursts repeat.
One headline number rarely settles anything by itself. A median of S$2,968 psf across 567 sales is a summary of eighteen very different months. The value is in seeing where the volume landed, how thin the recent months are, and how the figure sits against resales and other launches nearby. Read together, those pieces say more than any single line could.
Method: URA caveats for developer sales ('new sale') at the project, dated to the month. Size bands by the caveated floor area. The nearby comparison is resale caveats in completed projects within one kilometre over 24 months, unadjusted for size, age or floor. Units sold is the caveat count, which lags option exercises by weeks. Private figures are from URA Data Service caveats, HDB figures from data.gov.sg resale records, both loaded weekly by this site's ingest. Medians are of the non-excluded transactions in the period named. Sales flagged by the hygiene rules (related-party transfers, bulk deals, outliers) are left out. Every figure is indicative and drawn from recorded transactions, not a formal valuation. Facilities, layouts and photographs, where shown, are as supplied by the developer or seen on our own visit, and are not engine data.