Normanton Park Resales Hold Near $2,013 psf Over Four Quarters — But Our Estimate Missed With A 25.2% Median Error
Published 16 Nov 2026 · Normanton Park
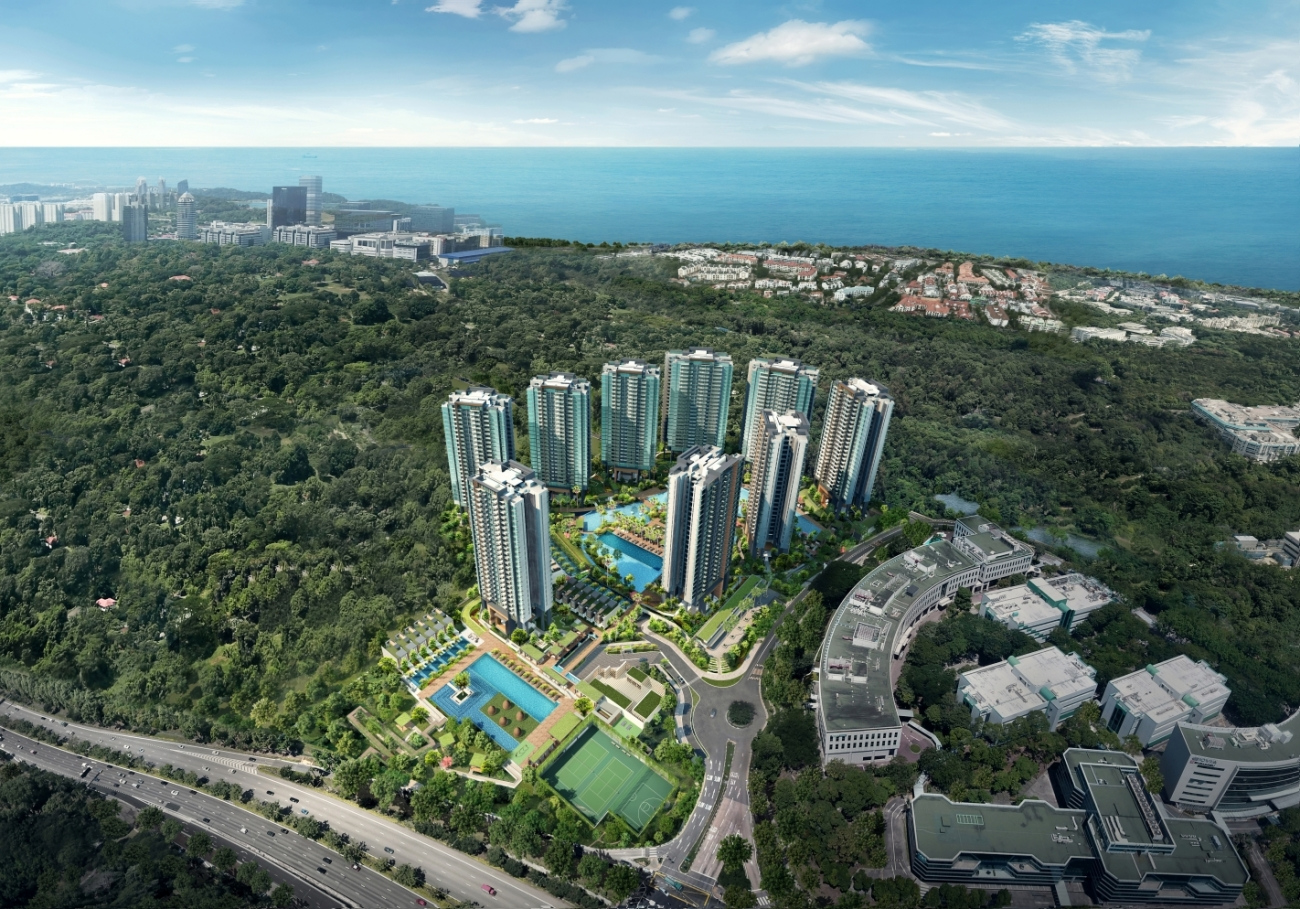
Normanton Park's resale prices look steady on the surface. Underneath, the lower end of the range has slipped and the neighbours trade in very different ways. Our own estimate has also struggled to keep pace here.
According to URA Data Service caveats, Normanton Park recorded 73 resales over 4Q2025 to 3Q2026 at a median of $2,013 psf. It is a 99-year leasehold in District 5 with 92 years of lease left. The quarterly median moved -1.2% across the three quarters shown. The district resale median was $1,881 psf from 749 sales, so the project sits +7.0% against it. URA rental contracts for 3Q2026 numbered 427, at a median of $6.27 psf a month, which gives a gross yield of about 3.7% against the resale median.
The quarterly resale median has barely moved across the three quarters shown
We start with the quarterly medians, because they show the direction first. At Normanton Park the median stood at $2,036 psf in 1Q2026 on 21 sales. By 3Q2026 it was $2,012 psf on 28 sales. The middle quarter was the lowest of the three, at $1,996 psf on 24 sales. So the path dipped and then recovered a little, and the chart below shows that shape. The moves between quarters are small next to the level itself. Each quarter's median also rests on a modest number of deals, so a handful of sales can nudge it either way.
The spread behind each median tells us a bit more. The 25th percentile slid from $1,961 psf in 1Q2026 to $1,927 psf in 2Q2026 and $1,867 psf in 3Q2026. The upper quartile sat at $2,077 psf, $2,083 psf and $2,061 psf over the same quarters. That suggests the lower end of the range has drifted down while the upper end stayed close to where it began. The medians alone hide this. Note also that the table and chart cover three quarters, while the 73 resales in our window run over four, starting in 4Q2025.
| Quarter | Resales | Median psf | 25th percentile | 75th percentile |
|---|---|---|---|---|
| Q1 2026 | 21 | S$2,036 psf | S$1,961 psf | S$2,077 psf |
| Q2 2026 | 24 | S$1,996 psf | S$1,927 psf | S$2,083 psf |
| Q3 2026 | 28 | S$2,012 psf | S$1,867 psf | S$2,061 psf |
Larger units trade at higher prices per square foot, and the 50 to 69 sqm band saw the most deals
Next we split the resales by unit size. Units of 50 to 69 sqm were the most traded, with 22 resales at a median of $1,304,000 ($1,970 psf). The median area in that band was 667 sqft. Units of 90 to 119 sqm came next with 20 resales, at a median of $2,234,000 and $2,066 psf. The 70 to 89 sqm band recorded 15 resales at $1,880,000, or $2,008 psf.
The price per square foot rises with each size band in the table below. Units under 50 sqm had a median of $1,710 psf from 11 resales, at a median price of $900,000. The largest band, 120 sqm and above, reached $2,147 psf. It rests on only 5 resales, so we would not lean on it. These medians describe recorded transactions in each band. They do not control for floor level, condition or facing, which can all differ within a band.
| Size band | Resales | Median area | Median price | Median psf |
|---|---|---|---|---|
| under 50 sqm | 11 | 527 sqft | S$900,000 | S$1,710 psf |
| 50 to 69 sqm | 22 | 667 sqft | S$1,304,000 | S$1,970 psf |
| 70 to 89 sqm | 15 | 915 sqft | S$1,880,000 | S$2,008 psf |
| 90 to 119 sqm | 20 | 1,076 sqft | S$2,234,000 | S$2,066 psf |
| 120 sqm and above | 5 | 1,313 sqft | S$2,830,000 | S$2,147 psf |
Rents have stayed in a narrow band, with the latest quarter the highest on both measures
The rental side moves in a tighter range than resale prices. Median rent was $6.2 psf a month in 4Q2025, then $6.1 in 1Q2026 and $6.0 in 2Q2026. It rose to $6.3 in 3Q2026. The median monthly rent followed a similar pattern: $3,900, $4,000, $3,900 and then $4,200. The latest quarter is the highest of the four on both measures.
Contract counts were less even. They ran at 381 in 4Q2025 and 445 in 1Q2026, then fell to 298 in 2Q2026 before returning to 427. Those counts come from URA rental contracts, and we cannot tell from them why volumes changed. Set against the resale median, the 3Q2026 rent gives a gross yield of about 3.7%, as measured by this site's own engine. That is a ratio of recorded rents to recorded resale prices, not a return on any one flat.
| Quarter | Contracts | Median rent (S$ psf a month) | Median monthly rent |
|---|---|---|---|
| Q4 2025 | 381 | 6.2 | S$3,900 |
| Q1 2026 | 445 | 6.1 | S$4,000 |
| Q2 2026 | 298 | 6.0 | S$3,900 |
| Q3 2026 | 427 | 6.3 | S$4,200 |
Kent Ridge Hill Residences is the only neighbour with more than a handful of resales
We also looked at every project within 1 km of Normanton Park. Kent Ridge Hill Residences, a 99-year leasehold 673 m away, logged 36 resales at a median of $1,984 psf. Every other project in the table below recorded three resales or fewer. That makes their medians fragile. Island View showed $1,334 psf on 3 resales and Springwood $2,012 psf on 3. Chelsea Village came in at $2,306 psf and Kentview Park at $1,462 psf, each on 2.
The landed streets in the table each have a single resale. Jalan Mat Jambol shows $3,458 psf, the highest figure on the list, from one sale. Chwee Chian View and Lorong Sari show $1,941 psf and $1,919 psf. Apart from Kent Ridge Hill Residences, all the neighbours are freehold, and the mix of tenure, age and building type differs from project to project. The table is a map of what traded nearby. It is not a like-for-like comparison with Normanton Park.
| Project | Tenure | TOP | Distance | Resales | Median psf |
|---|---|---|---|---|---|
| Kent Ridge Hill Residences | 99-year leasehold | — | 673 m | 36 | S$1,984 psf |
| Island View | freehold | — | 786 m | 3 | S$1,334 psf |
| Springwood | freehold | — | 723 m | 3 | S$2,012 psf |
| Chelsea Village | freehold | — | 926 m | 2 | S$2,306 psf |
| Kentview Park | freehold | — | 973 m | 2 | S$1,462 psf |
| Landed, Chwee Chian View | freehold | — | 885 m | 1 | S$1,941 psf |
| Landed, Jalan Mat Jambol | freehold | — | 924 m | 1 | S$3,458 psf |
| Landed, Lorong Sari | freehold | — | 985 m | 1 | S$1,919 psf |
The five highest resale prices all sit in the largest unit type, between $2,760,000 and $2,910,000
The top end of the market here is a narrow group. The highest resale price in the window was $2,910,000 in 2Q2026, for a 1,313 sqft unit on the 11-15 storey range, at $2,216 psf. The next was $2,838,000 in 3Q2026 on the 16-20 range, at $2,161 psf.
Third came a 1,335 sqft unit on the 01-05 range at $2,830,000, or $2,120 psf. That is the lowest floor range among the five, and its price per square foot is among the lower ones listed. A unit at $2,820,000 on the 11-15 range, at $2,147 psf, and one at $2,760,000 on the 06-10 range, at $2,102 psf, complete the list. Four of the five are 1,313 sqft. With so few top-end deals, we cannot say how much the floor range moved any of these prices.
| Quarter | Storey range | Area | Price | Per sqft |
|---|---|---|---|---|
| Q2 2026 | 11-15 | 1,313 sqft | S$2,910,000 | S$2,216 psf |
| Q3 2026 | 16-20 | 1,313 sqft | S$2,838,000 | S$2,161 psf |
| Q2 2026 | 01-05 | 1,335 sqft | S$2,830,000 | S$2,120 psf |
| Q2 2026 | 11-15 | 1,313 sqft | S$2,820,000 | S$2,147 psf |
| Q3 2026 | 06-10 | 1,313 sqft | S$2,760,000 | S$2,102 psf |
Our own estimate has not tracked Normanton Park prices closely
We also test our estimate against what sold later, and Normanton Park is a case where it fell short. Tested as of 1Q2026 against 74 later sales at the project, the estimate had a median error of 25.2%. None of those sales, 0%, landed inside the stated range. Those figures come from this site's own engine.
We report this plainly because the other figures in this piece are recorded transactions, while the estimate is a model. It is indicative only and never a formal valuation of any home. The test does not tell us why the gap is so wide at this project. It shows that, for Normanton Park, recorded sale prices have sat outside the range our estimate gave.
The figures leave a few things open. We have only three quarters of quarterly medians, so a trend is hard to separate from noise. The size bands with the fewest sales, and every neighbour apart from Kent Ridge Hill Residences, rest on thin counts. In the next quarter's data we will watch whether the median stays near $2,012 psf, whether the lower end of the range keeps moving, and whether rents hold at $6.27 psf a month. We will also see whether the estimate's error changes.
A single headline figure is rarely enough on its own, and the same is true here. A flat median can hide a shifting spread, and a clean yield can hide uneven rental volumes. The value lies in how each number fits the broader direction of the market, and that only shows up quarter after quarter.
Method: URA resale caveats at the project (developer sales and sub-sales excluded) by the quarter of the sale month. Size bands by caveated floor area. Rents are URA rental contracts at the project, and the gross yield is the mean of the quarterly median rents per square foot, annualised, over the four-quarter resale median per square foot, before any cost. Lease left is the tenure less the years since the lease started, as recorded. The estimate accuracy is this site's backtest: the engine run as of the quarter named, compared with the sales since. Private figures are from URA Data Service caveats, HDB figures from data.gov.sg resale records, both loaded weekly by this site's ingest. Medians are of the non-excluded transactions in the period named. Sales flagged by the hygiene rules (related-party transfers, bulk deals, outliers) are left out. Every figure is indicative and drawn from recorded transactions, not a formal valuation. Facilities, layouts and photographs, where shown, are as supplied by the developer or seen on our own visit, and are not engine data.