Normanton Park Posted 45 Resales At A Median Of S$2,015 psf — But The Latest Quarter Came In Lower
Published 7 Oct 2026 · Normanton Park
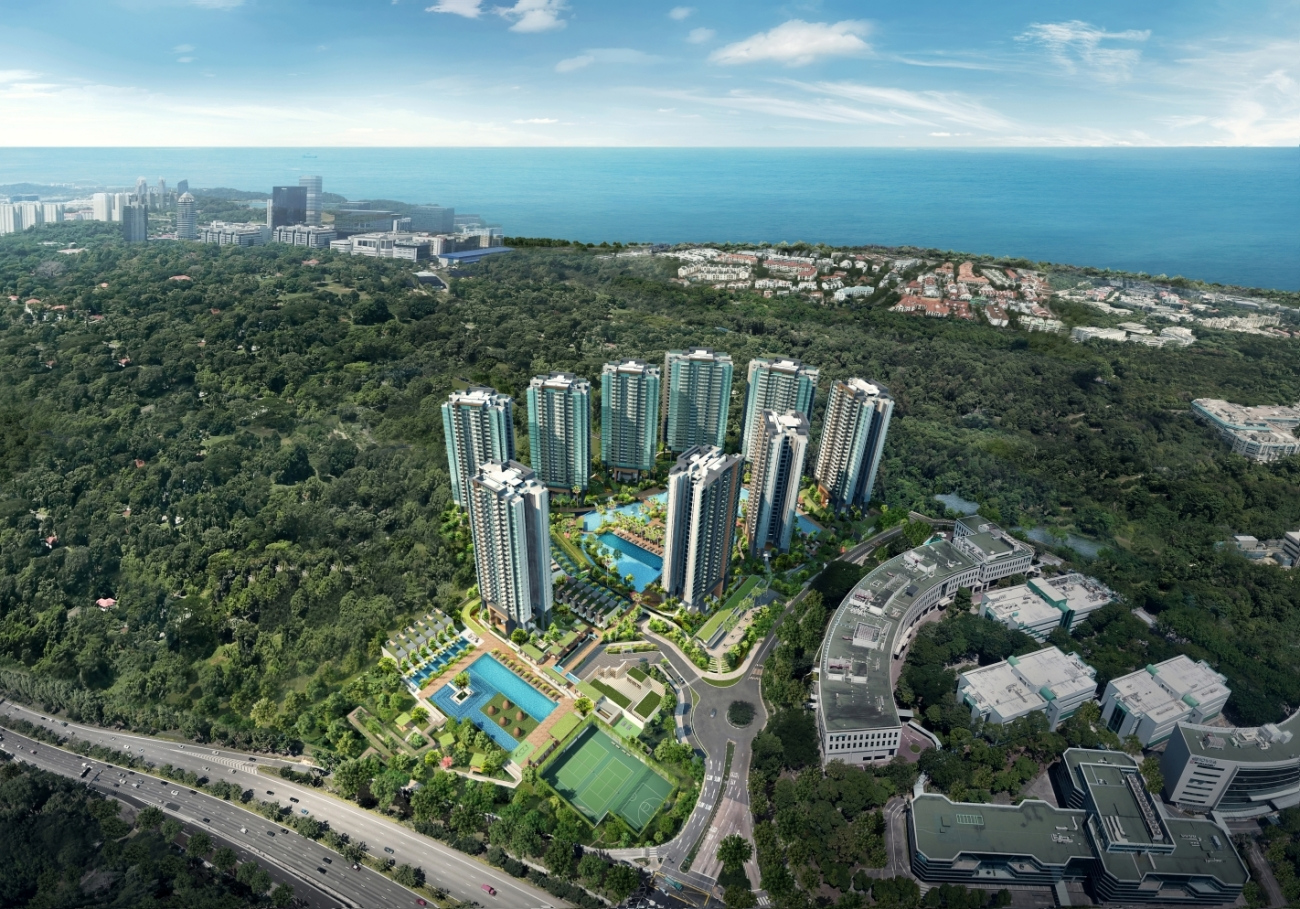
A project can trade above its district and still see its own median drift down. Normanton Park is doing both at once, and the gap between those two readings is what we wanted to walk through.
According to URA Data Service caveats, Normanton Park recorded 45 resales over 3Q2025 to 2Q2026 at a median of S$2,015 psf. It is a 99-year leasehold apartment project in District 5, in the RCR, with 92 years of lease left. Over the same four quarters, the district's resale median was S$1,858 psf from 743 sales. Normanton Park sits +8.4% against that.
The quarterly median slipped between the two quarters we can see
The quarterly breakdown only covers two periods. In 1Q2026 there were 21 resales at a median of S$2,036 psf. In 2Q2026 there were 24 resales at a median of S$1,996 psf. That is a move of -2.0% q-o-q.
Volume went up while the median went down. That combination is worth flagging, but two quarters is a short series. With counts in the low twenties, a shift in which stacks and sizes transacted can move the median on its own. The data does not tell us the mix behind each quarter.
The quartile figures are the more useful read here. The lower quartile eased from S$1,961 psf to S$1,927 psf. The upper quartile went the other way, from S$2,077 psf to S$2,083 psf. So the spread widened a little at both ends. That points to a range of pricing rather than a clean move down across the board.
| Quarter | Resales | Median psf | 25th percentile | 75th percentile |
|---|---|---|---|---|
| Q1 2026 | 21 | S$2,036 psf | S$1,961 psf | S$2,077 psf |
| Q2 2026 | 24 | S$1,996 psf | S$1,927 psf | S$2,083 psf |
The most traded size band is not the one pricing highest per square foot
Units of 50 to 69 sqm were the busiest, with 16 resales at a median of S$1,293,000 (S$1,959 psf). The median area in that band was 662 sqft. That is the volume centre of this project over the window.
Per square foot, the figures rise steadily with size. Under 50 sqm sits at S$1,779 psf on 6 resales. The 70 to 89 sqm band is at S$2,001 psf on 8 resales, and 90 to 119 sqm at S$2,090 psf on 12. The largest band, 120 sqm and above, shows S$2,147 psf, but only 3 resales sit behind it.
That last number carries the least weight. Three transactions is not a median you would lean on. The pattern across the other bands is consistent enough to note, though smaller units here do not carry the psf premium you often see elsewhere. The table below breaks it out.
| Size band | Resales | Median area | Median price | Median psf |
|---|---|---|---|---|
| under 50 sqm | 6 | 517 sqft | S$908,500 | S$1,779 psf |
| 50 to 69 sqm | 16 | 662 sqft | S$1,293,000 | S$1,959 psf |
| 70 to 89 sqm | 8 | 840 sqft | S$1,725,000 | S$2,001 psf |
| 90 to 119 sqm | 12 | 1,082 sqft | S$2,255,000 | S$2,090 psf |
| 120 sqm and above | 3 | 1,313 sqft | S$2,830,000 | S$2,147 psf |
Rental contracts dropped in the latest quarter and median psf rent eased with them
Rental approvals give a much larger sample than resales. Normanton Park logged 199 contracts in 3Q2025 and 201 in 4Q2025, both at a median of S$6.20 psf a month. The count then rose to 265 in 1Q2026 at S$6.10 psf a month.
In 2Q2026 the count fell to 162, with the median at S$6.00 psf a month and a median monthly rent of S$3,900. That is the same median monthly rent recorded in 4Q2025. Lease cycles at a large project can bunch into particular quarters, so a single quarter's contract count is not a trend on its own.
Set the 2Q2026 rent median against the 2Q2026 resale median and our engine measures a gross yield of about 3.6%. That is a gross figure from recorded contracts and recorded caveats. It carries no deduction for maintenance, tax or vacancy.
| Quarter | Contracts | Median rent (S$ psf a month) | Median monthly rent |
|---|---|---|---|
| Q3 2025 | 199 | 6.2 | S$4,100 |
| Q4 2025 | 201 | 6.2 | S$3,900 |
| Q1 2026 | 265 | 6.1 | S$3,970 |
| Q2 2026 | 162 | 6.0 | S$3,900 |
Within 1 km, only one neighbour trades in any real volume
The nearby table is thin almost everywhere except one line. Kent Ridge Hill Residences, 673 m away and also 99-year leasehold, recorded 35 resales at a median of S$1,997 psf over the window. That is the only comparable with a sample worth reading.
After that the counts collapse. Springwood had 4 resales at S$1,972 psf. Island View had 3 at S$1,357 psf. Kentview Park and Chelsea Village had 2 each, at S$1,462 psf and S$2,306 psf. Bayville Condominium had 1, at S$1,429 psf.
The two landed entries show the limits plainly. One transaction at Chwee Chian View printed S$1,941 psf, and one at Jalan Mat Jambol printed S$3,458 psf. Single sales of landed homes tell you about those homes, not about the street. Read the table below with the sales column in view.
| Project | Tenure | TOP | Distance | Resales | Median psf |
|---|---|---|---|---|---|
| Kent Ridge Hill Residences | 99-year leasehold | — | 673 m | 35 | S$1,997 psf |
| Springwood | freehold | — | 723 m | 4 | S$1,972 psf |
| Island View | freehold | — | 786 m | 3 | S$1,357 psf |
| Kentview Park | freehold | — | 973 m | 2 | S$1,462 psf |
| Chelsea Village | freehold | — | 926 m | 2 | S$2,306 psf |
| Bayville Condominium | freehold | — | 843 m | 1 | S$1,429 psf |
| Landed, Chwee Chian View | freehold | — | 885 m | 1 | S$1,941 psf |
| Landed, Jalan Mat Jambol | freehold | — | 924 m | 1 | S$3,458 psf |
Every one of the top prices but one landed in the latest quarter
The highest resale price in the window was S$2,910,000 in 2Q2026. That was a 1,313 sqft unit in the 11-15 storey range, at S$2,216 psf. It is also the highest psf among the top five prices listed.
Four of the five largest prices were recorded in 2Q2026, the same quarter the project median eased. A 1,335 sqft unit on the 01-05 range went at S$2,830,000 (S$2,120 psf). Another 1,313 sqft unit on 11-15 went at S$2,820,000 (S$2,147 psf). The 1Q2026 entry was a 1,195 sqft unit at S$2,587,000 (S$2,165 psf).
Storey is not doing much work in this short list. The 21-25 entry, a 1,238 sqft unit at S$2,500,000, shows S$2,020 psf. That is the lowest psf of the five. With five records, we cannot separate floor from stack or from facing.
| Quarter | Storey range | Area | Price | Per sqft |
|---|---|---|---|---|
| Q2 2026 | 11-15 | 1,313 sqft | S$2,910,000 | S$2,216 psf |
| Q2 2026 | 01-05 | 1,335 sqft | S$2,830,000 | S$2,120 psf |
| Q2 2026 | 11-15 | 1,313 sqft | S$2,820,000 | S$2,147 psf |
| Q1 2026 | 01-05 | 1,195 sqft | S$2,587,000 | S$2,165 psf |
| Q2 2026 | 21-25 | 1,238 sqft | S$2,500,000 | S$2,020 psf |
In pictures
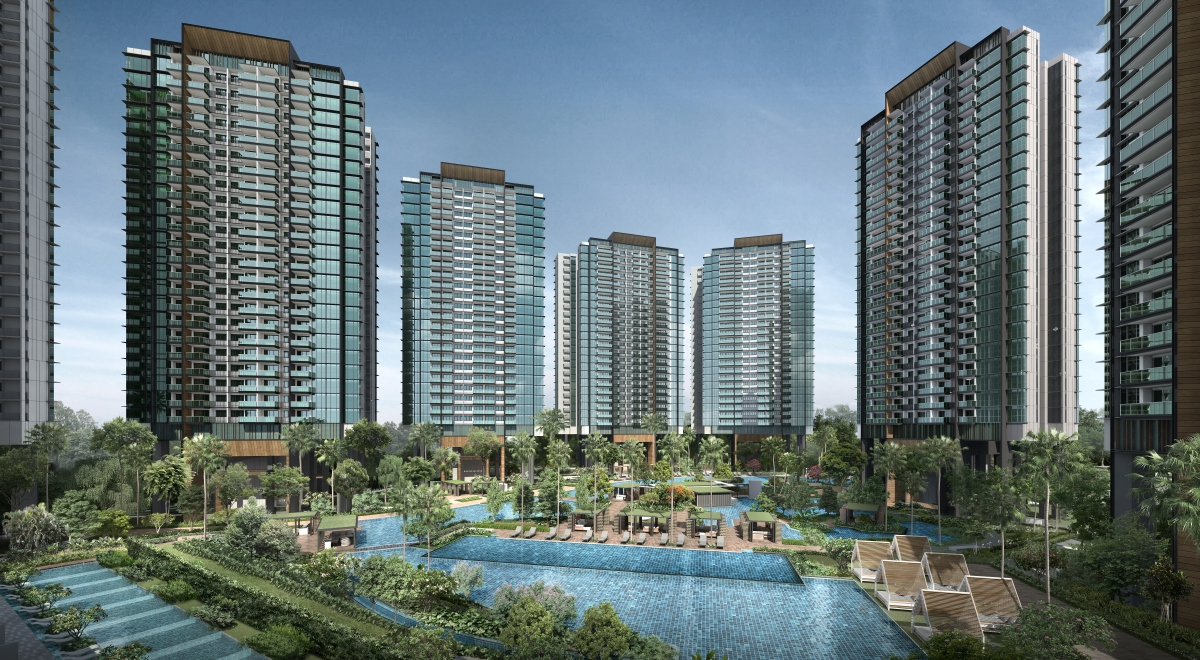
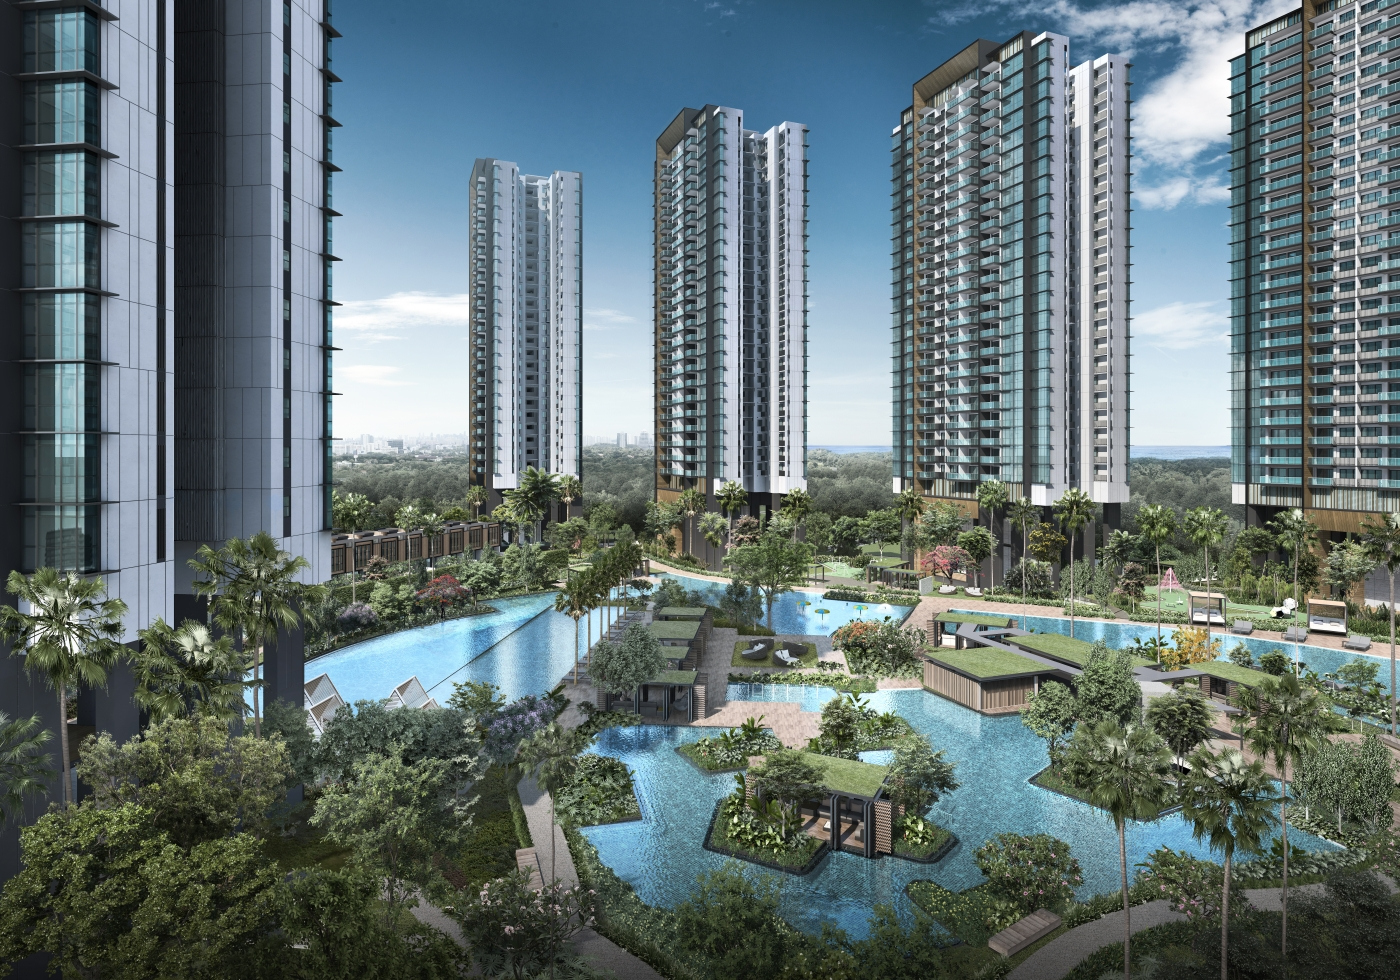
Two quarters of resale data leave a lot open. We cannot say whether the -2.0% q-o-q move reflects pricing or mix. The large-unit band rests on three sales. The rental series, with 162 contracts in 2Q2026, is the one line here with real depth. The next quarter's caveats will show whether the median settles back near S$2,036 psf or holds under S$2,000 psf. The contract count is the other thing to watch, since 1Q2026 and 2Q2026 were far apart on that measure.
One median rarely settles anything by itself. What makes these figures useful is the way they sit together: a project trading above its district, a quarterly median that slipped, and rents that eased while volume swung. Each of these comes from recorded transactions and recorded contracts, and none is a valuation of any home. Read them as a direction, not a verdict.
Method: URA resale caveats at the project (developer sales and sub-sales excluded) by the quarter of the sale month. Size bands by caveated floor area. Rents are URA rental contracts at the project, and the gross yield is the mean of the quarterly median rents per square foot, annualised, over the four-quarter resale median per square foot, before any cost. Lease left is the tenure less the years since the lease started, as recorded. The estimate accuracy is this site's backtest: the engine run as of the quarter named, compared with the sales since. Private figures are from URA Data Service caveats, HDB figures from data.gov.sg resale records, both loaded weekly by this site's ingest. Medians are of the non-excluded transactions in the period named. Sales flagged by the hygiene rules (related-party transfers, bulk deals, outliers) are left out. Every figure is indicative and drawn from recorded transactions, not a formal valuation.