Kingsford Waterbay By The Numbers: 54 Resales At A Median Of S$1,467 psf — And A Project Sitting 10.7% Below Its Own District
Published 10 Oct 2026 · Kingsford Waterbay
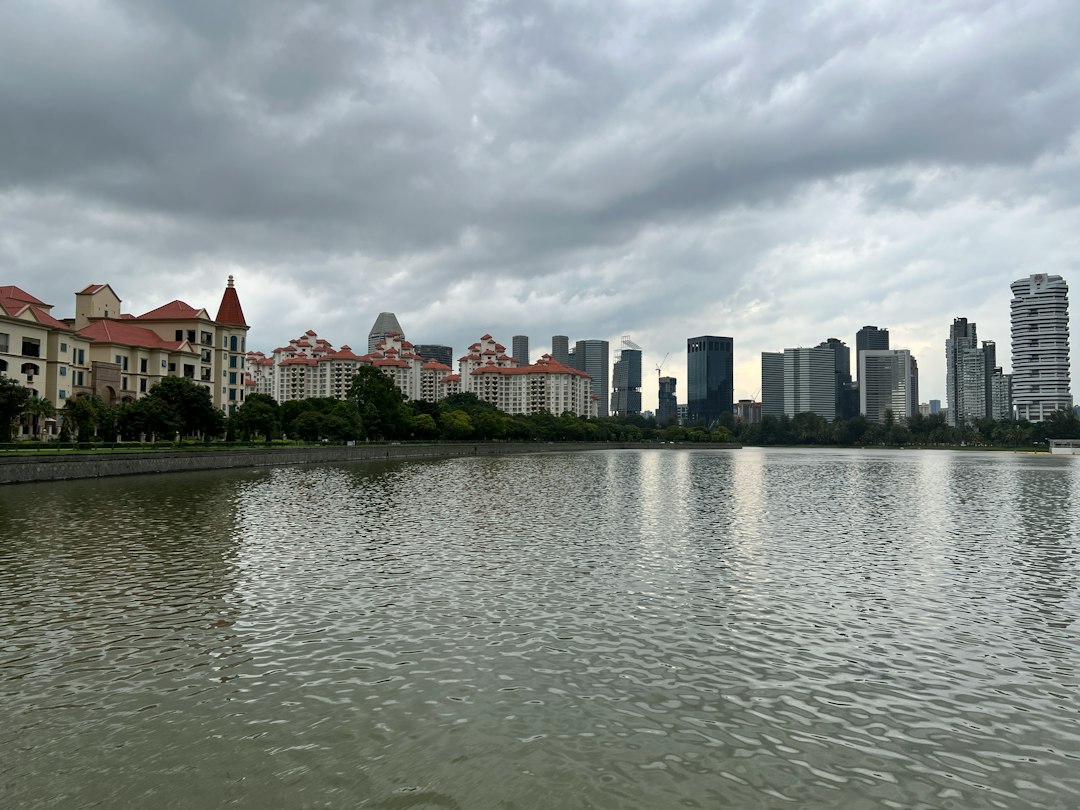
Some projects tell their story through price moves. This one tells it through how little the headline number has shifted, and how much sits underneath it. Kingsford Waterbay has traded steadily for two years, yet the per-square-foot figure ends up close to where it began. The interesting parts are in the size bands, the rents and the neighbours.
According to URA Data Service caveats, Kingsford Waterbay recorded 54 resales over 3Q2025 to 2Q2026, at a median of S$1,467 psf. It is a 99-year leasehold apartment project in District 19, with 87 years of lease left. Across the eight quarters shown, the quarterly resale median moved +1.2%, from S$1,452 psf in 3Q2024 to S$1,468 psf in 2Q2026. Over the same four-quarter window, the district's resale median was S$1,644 psf from 2,311 sales. Kingsford Waterbay sits -10.7% against that.
The eight-quarter line is close to flat, and the latest quarter sits in the middle of its own range
Here is what stood out to us first. The quarterly median has stayed inside a narrow band for two years. It opened at S$1,452 psf in 3Q2024 and closed at S$1,468 psf in 2Q2026. The high point of the series is 1Q2026, at S$1,497 psf. The low point is 4Q2025, at S$1,448 psf. Those two quarters sit side by side in the table, and both rest on 10 sales each. That is a thin base. With counts that small, a few transactions on higher or lower floors can shift the median on their own.
Volume is the other thing to read here. There were 26 resales in 4Q2024 and 23 in 1Q2025. By 4Q2025 and 1Q2026 the count was 10 in each quarter. It picked back up to 16 in 2Q2026, matching 2Q2025. The quartile band in 2Q2026 ran from S$1,442 psf to S$1,515 psf. In 3Q2024 it ran from S$1,405 psf to S$1,489 psf. The middle has barely moved. The upper edge has drifted up a little. The table and the chart below show the full series.
| Quarter | Resales | Median psf | 25th percentile | 75th percentile |
|---|---|---|---|---|
| Q3 2024 | 21 | S$1,452 psf | S$1,405 psf | S$1,489 psf |
| Q4 2024 | 26 | S$1,465 psf | S$1,426 psf | S$1,518 psf |
| Q1 2025 | 23 | S$1,450 psf | S$1,394 psf | S$1,493 psf |
| Q2 2025 | 16 | S$1,453 psf | S$1,431 psf | S$1,488 psf |
| Q3 2025 | 18 | S$1,461 psf | S$1,421 psf | S$1,489 psf |
| Q4 2025 | 10 | S$1,448 psf | S$1,432 psf | S$1,498 psf |
| Q1 2026 | 10 | S$1,497 psf | S$1,463 psf | S$1,519 psf |
| Q2 2026 | 16 | S$1,468 psf | S$1,442 psf | S$1,515 psf |
The smaller units are trading at a higher psf than the larger ones
Split the same 54 resales by size and the pattern is clean. Units under 50 sqm had a median of S$1,508 psf, on a median area of 474 sqft and a median price of S$720,500. The 50 to 69 sqm band was the busiest, with 20 resales. Its median price was S$1,016,944, or S$1,497 psf, on a median area of 678 sqft. Move up a band and the psf drops. The 70 to 89 sqm band came in at S$1,444 psf, with a median price of S$1,270,000. The largest band in the window, 90 to 119 sqm, sat at S$1,443 psf and a median price of S$1,570,000.
So the gap in psf between the smallest and largest bands is wider than anything the quarterly series shows. That matters when you read the project median. The S$1,467 psf figure is a blend of these four bands. If the mix of sizes sold shifts in a given quarter, the headline psf can move without any single unit type repricing. The counts at the ends of the table are also thin, so treat those two bands with more caution than the middle two. The size breakdown is below.
| Size band | Resales | Median area | Median price | Median psf |
|---|---|---|---|---|
| under 50 sqm | 8 | 474 sqft | S$720,500 | S$1,508 psf |
| 50 to 69 sqm | 20 | 678 sqft | S$1,016,944 | S$1,497 psf |
| 70 to 89 sqm | 17 | 883 sqft | S$1,270,000 | S$1,444 psf |
| 90 to 119 sqm | 9 | 1,055 sqft | S$1,570,000 | S$1,443 psf |
Rents dipped and then came back up, with the latest quarter at S$5.00 psf a month
The rental side has more contracts behind it than the resale side. There were 56 rental contracts in 3Q2025, then 41, then 47, then 51 in 2Q2026. The median rent per square foot went from 4.9 in 3Q2025 down to 4.8 in the two middle quarters, then up to 5.0 in 2Q2026. Median monthly rent followed a slightly different path. It was S$3,200 in 3Q2025 and 4Q2025, S$3,000 in 1Q2026, and S$3,100 in 2Q2026. The psf figure and the monthly figure do not always move together, because the mix of unit sizes leased changes each quarter.
Set the 2Q2026 rental median against the resale median and the engine measures a gross yield of about 4.0%. That is a measured figure from recorded contracts and recorded resales, not a projection of what any single unit earns. It takes no account of vacancy, fees or any other cost. The rental table is below.
| Quarter | Contracts | Median rent (S$ psf a month) | Median monthly rent |
|---|---|---|---|
| Q3 2025 | 56 | 4.9 | S$3,200 |
| Q4 2025 | 41 | 4.8 | S$3,200 |
| Q1 2026 | 47 | 4.8 | S$3,000 |
| Q2 2026 | 51 | 5.0 | S$3,100 |
Within 1 km, the median psf runs from S$1,157 to S$1,744
Eight projects within 1 km recorded resales over 3Q2025 to 2Q2026, and all eight are 99-year leasehold. The spread between them is wide. Riverfront Residences, 255 m away, had the highest median at S$1,744 psf, and by some distance the most volume, at 99 resales. Park Green, 942 m away, had the lowest at S$1,157 psf from 12 resales. Rio Vista is the closest in the set, 104 m away, with 23 resales at S$1,225 psf. Riversails, at 562 m, came in at S$1,478 psf from 33 resales.
Distance does not line up with price here. The nearest project and the second furthest sit at the two lower ends of the range. That points to differences in age and unit mix across the eight, which this table does not break out. It is worth holding that in mind alongside the -10.7% gap to the district median. District 19 covers far more ground than a 1 km radius, and 2,311 sales is a broad base. The neighbour table is below.
| Project | Tenure | TOP | Distance | Resales | Median psf |
|---|---|---|---|---|---|
| Riverfront Residences | 99-year leasehold | — | 255 m | 99 | S$1,744 psf |
| Austville Residences | 99-year leasehold | — | 826 m | 38 | S$1,370 psf |
| Riversails | 99-year leasehold | — | 562 m | 33 | S$1,478 psf |
| Rio Vista | 99-year leasehold | — | 104 m | 23 | S$1,225 psf |
| Riversound Residence | 99-year leasehold | — | 902 m | 22 | S$1,418 psf |
| Boathouse Residences | 99-year leasehold | — | 327 m | 21 | S$1,430 psf |
| Heron Bay | 99-year leasehold | — | 349 m | 20 | S$1,394 psf |
| Park Green | 99-year leasehold | — | 942 m | 12 | S$1,157 psf |
The biggest cheques in the window did not come at the highest psf
The highest resale price over the four quarters was S$1,650,000, in 1Q2026, for a 1,033 sqft unit in the 11-15 storey range. That worked out to S$1,597 psf. The next two were both in 2Q2026, in the 16-20 storey range: S$1,600,000 for 1,109 sqft at S$1,443 psf, and S$1,590,888 for 1,098 sqft at S$1,449 psf. Both are higher-floor units, and both sit at a lower psf than the 1Q2026 sale.
The fourth entry makes the point plainly. A 1,033 sqft unit in the 06-10 storey range went for S$1,590,000, or S$1,539 psf. That is a lower price than the two above it, on a higher psf, from a lower floor. Larger area pushes the total price up and the psf down. Three of the five top prices landed in 2Q2026, which is also one of the busier recent quarters. The list of top prices is below.
| Quarter | Storey range | Area | Price | Per sqft |
|---|---|---|---|---|
| Q1 2026 | 11-15 | 1,033 sqft | S$1,650,000 | S$1,597 psf |
| Q2 2026 | 16-20 | 1,109 sqft | S$1,600,000 | S$1,443 psf |
| Q2 2026 | 16-20 | 1,098 sqft | S$1,590,888 | S$1,449 psf |
| Q2 2026 | 06-10 | 1,033 sqft | S$1,590,000 | S$1,539 psf |
| Q3 2025 | 16-20 | 1,109 sqft | S$1,570,000 | S$1,416 psf |
Our own estimate at this project was off by a median of 2.1% against 56 later sales
We test our estimates against sales that happened after the estimate was made. At Kingsford Waterbay, as of 4Q2025, the engine was tested against 56 later sales. The median error was 2.1%. Of those sales, 39% landed inside the stated range. That second figure is the one we would read closely. It says the range we publish was tighter than the actual spread of outcomes at this project more often than not. Every figure here is indicative and drawn from recorded transactions. None of it is a formal valuation of any home.
A few things the figures do not settle. Resale counts fell to 10 in two of the last four quarters, then recovered to 16 in 2Q2026. Whether that is a durable return of volume is not something four quarters can answer. The size mix is the other open question. The psf gap between the smallest and largest bands is wide enough that a change in which units trade can move the project median on its own. On the rental side, contract counts have stayed in the forties and fifties each quarter, so the 2Q2026 reading of S$5.00 psf a month rests on a reasonably firm base. The next quarter's URA caveats and rental contracts will show whether both series hold.
What we take from this one is that a flat headline can hide a lot of structure. The project median has moved +1.2% across eight quarters, which on its own says very little. The size bands, the neighbour spread and the rental series each say something the headline cannot. A single number is rarely the story. It is worth more once you can see where it sits in the direction of everything around it.
Method: URA resale caveats at the project (developer sales and sub-sales excluded) by the quarter of the sale month. Size bands by caveated floor area. Rents are URA rental contracts at the project, and the gross yield is the mean of the quarterly median rents per square foot, annualised, over the four-quarter resale median per square foot, before any cost. Lease left is the tenure less the years since the lease started, as recorded. The estimate accuracy is this site's backtest: the engine run as of the quarter named, compared with the sales since. Private figures are from URA Data Service caveats, HDB figures from data.gov.sg resale records, both loaded weekly by this site's ingest. Medians are of the non-excluded transactions in the period named. Sales flagged by the hygiene rules (related-party transfers, bulk deals, outliers) are left out. Every figure is indicative and drawn from recorded transactions, not a formal valuation.