Hudson Place Residences: 192 Units Sold At A Median Of S$2,486 psf (September 2026)
Published 23 Oct 2026 · Hudson Place Residences
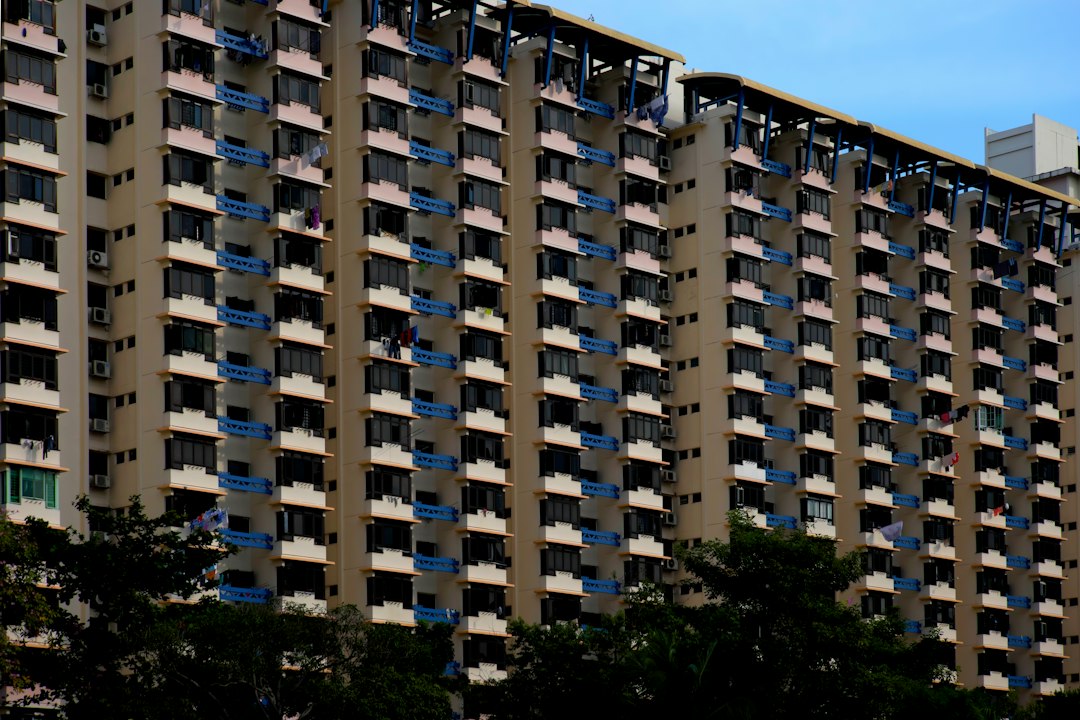
If you have been watching new launches in District 5, Hudson Place Residences has been one of the busier names this year. Five months of caveats are now on record, so there is enough data to see how the sales have run.
In this article, we look at developer sales at Hudson Place Residences month by month and by unit size. We also compare the project with resales within 1 km and with other launches in the same district.
Based on URA Data Service caveat records, the project has recorded 192 developer sales since May 2026 at an overall median of S$2,486 psf. That is 58.7% of its 327 units.
How Have Sales Run Month By Month?
The project is a 99-year leasehold development in District 5, with an expected TOP of 2029. Sales began in May 2026, and 37 of the caveats fall in the three months to September 2026.
The table and chart below set out the monthly caveats and the median psf for each month.
The table shows May 2026 as the busiest month by far, with 146 caveats. Volumes after that stayed in single digits or low double digits, with 7 caveats in September 2026. Note that the median psf moved only +0.1% from S$2,467 psf in the first month to S$2,468 psf in September 2026, even though the months in between printed higher medians. With so few caveats in each later month, the monthly medians can swing on the mix of units sold.
| Month | Caveats | Cumulative | Median psf |
|---|---|---|---|
| May 2026 | 146 | 146 | S$2,467 psf |
| June 2026 | 9 | 155 | S$2,582 psf |
| July 2026 | 21 | 176 | S$2,612 psf |
| August 2026 | 9 | 185 | S$2,640 psf |
| September 2026 | 7 | 192 | S$2,468 psf |
Which Unit Sizes Sold Most?
Caveats also record the floor area of each unit sold, so the sales can be grouped by size band. One band accounts for most of the transactions here.
The table below breaks the 192 developer sales down by size band.
Units of 50 to 69 sqm were the most sold band, with 120 caveats at a median of S$1,684,500, or S$2,504 psf. The 90 to 119 sqm band follows with 56 caveats at a median of S$2,597,000. The largest band, 120 sqm and above, has just 4 caveats at a median of S$3,760,500, or S$2,620 psf, so that figure rests on a very small count.
| Size band | Caveats | Median area | Median price | Median psf |
|---|---|---|---|---|
| 50 to 69 sqm | 120 | 667 sqft | S$1,684,500 | S$2,504 psf |
| 70 to 89 sqm | 12 | 893 sqft | S$2,155,000 | S$2,412 psf |
| 90 to 119 sqm | 56 | 1,055 sqft | S$2,597,000 | S$2,452 psf |
| 120 sqm and above | 4 | 1,432 sqft | S$3,760,500 | S$2,620 psf |
How Does It Compare With Resales Nearby?
A launch median sits above or below what nearby completed projects fetch on the resale market. Within 1,000 m of Hudson Place Residences, 98 resales across 2 completed projects were recorded over the 24 months to September 2026, at a median of S$1,951 psf. The launch median is +27.4% against that.
The table below lists those two projects.
Normanton Park, 879 m away, accounts for 72 of the resales at a median of S$2,012 psf. One-North Residences, at 984 m, recorded 26 resales at a median of S$1,727 psf. Both are 99-year leasehold. These are completed homes rather than new units, so age, layout and floor level differ from the launch stock.
| Project | Tenure | TOP | Distance | Resales | Median psf |
|---|---|---|---|---|---|
| Normanton Park | 99-year leasehold | — | 879 m | 72 | S$2,012 psf |
| One-North Residences | 99-year leasehold | — | 984 m | 26 | S$1,727 psf |
What Are Other District 5 Launches Doing?
Hudson Place Residences is not the only project selling in District 5. Over the 12 months to September 2026, eight other launches recorded developer sales.
The table below ranks them by caveat count.
Faber Residence sold the most, with 220 caveats at a median of S$2,162 psf. Bloomsbury Residences follows with 114 caveats at S$2,561 psf, then Elta with 79 at S$2,566 psf. Terra Hill, one of two freehold names on the list, recorded 69 caveats at a median of S$2,653 psf. Several projects near the foot of the table have fewer than 10 caveats each, so their medians cover very few units.
| Project | Tenure | Expected TOP | Caveats | Median psf |
|---|---|---|---|---|
| Faber Residence | 99-year leasehold | 2,028 | 220 | S$2,162 psf |
| Bloomsbury Residences | 99-year leasehold | 2,028 | 114 | S$2,561 psf |
| Elta | 99-year leasehold | — | 79 | S$2,566 psf |
| Terra Hill | freehold | — | 69 | S$2,653 psf |
| Blossoms By The Park | 99-year leasehold | — | 11 | S$2,397 psf |
| The Hillshore | freehold | — | 7 | S$2,343 psf |
| Lyndenwoods | 99-year leasehold | 2,028 | 7 | S$2,516 psf |
| The Hill @One-North | 99-year leasehold | — | 6 | S$2,450 psf |
Summary
Hudson Place Residences has recorded 192 developer sales since May 2026, or 58.7% of its 327 units, at an overall median of S$2,486 psf. May 2026 carried 146 of those caveats, and the median psf has moved +0.1% between the first month and September 2026. The 50 to 69 sqm band leads on volume with 120 caveats at a median of S$1,684,500.
These are indicative figures from recorded caveats, not valuations of any home. They show what buyers paid and when, by month and by size band. They do not show unsold stock, launch phasing, discounts or the stack and floor of each unit, and small monthly counts mean a single transaction can shift a median.
Method: URA caveats for developer sales ('new sale') at the project, dated to the month. Size bands by the caveated floor area. The nearby comparison is resale caveats in completed projects within one kilometre over 24 months, unadjusted for size, age or floor. Units sold is the caveat count, which lags option exercises by weeks. Private figures are from URA Data Service caveats, HDB figures from data.gov.sg resale records, both loaded weekly by this site's ingest. Medians are of the non-excluded transactions in the period named. Sales flagged by the hygiene rules (related-party transfers, bulk deals, outliers) are left out. Every figure is indicative and drawn from recorded transactions, not a formal valuation.