A District 27 Unit At The $1,314,000 Median Needs $365,660 Before The Loan — And Costs $235,643 To Hold For Five Years
Published 6 Nov 2026
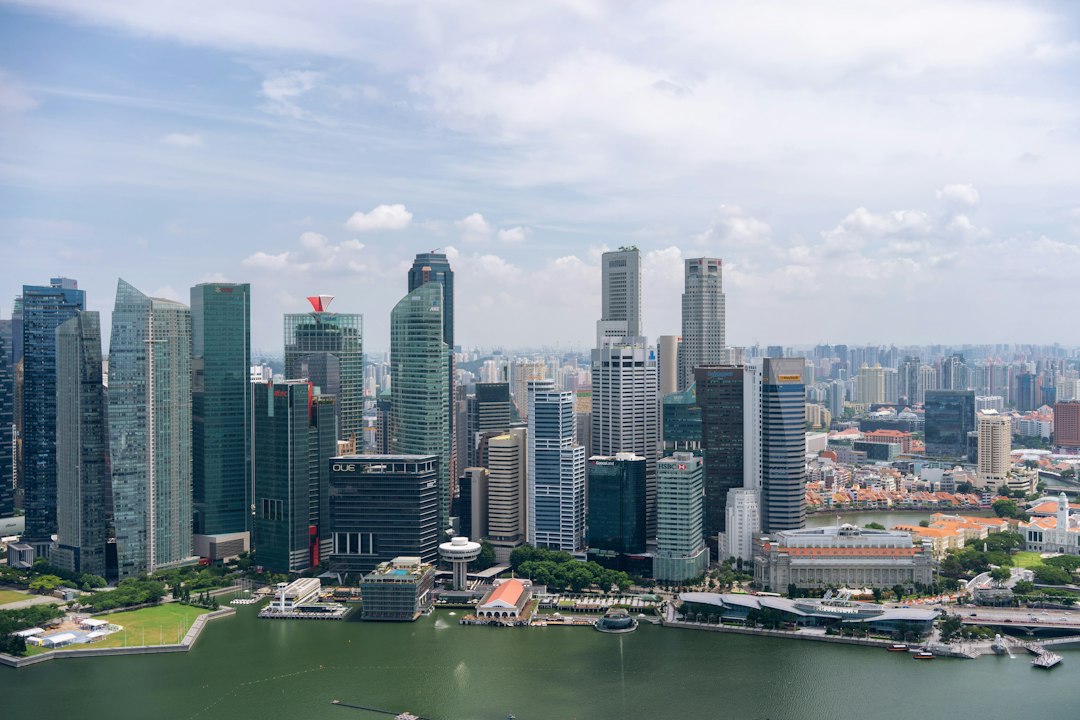
This is an illustrative example built on the quarter's median price and a stated buyer profile. It is not a real purchase, not a valuation of any home, and not advice on whether or how to buy. Every figure in it is computed from recorded transactions and the tax and financing rules recorded as in force.
A median price is one number, but the bill around it is made of many smaller ones. They change a great deal depending on who is buying and for how long they hold.
According to URA Data Service caveats, District 27 (Yishun, Sembawang) recorded 66 sales of 60 to 99 sqm private units in 2Q2026. The median price was $1,314,000, up 2.7% y-o-y from $1,280,000. We used this site's position engine to build an example on that median. The buyer is a 35-year-old Singapore citizen with a first home, a household income of $18,000 a month and a 25-year bank loan. Here's what stood out to us: $365,660 before the loan, and $235,643 over five years of holding.
The median comes from 66 sales, and one quarter's count has limits
Everything in the example hangs on one number, so we looked at it first. The median price in District 27 (Yishun, Sembawang) was $1,314,000 in 2Q2026, from 66 sales of 60 to 99 sqm units. The median per area was $1,379 psf, at a median size of 942 sqft. A year earlier the median stood at $1,280,000, so the y-o-y change is +2.7%. The table below sets out the sales behind the median. We use the median price as the purchase price for the whole example. Every other figure in this piece follows from that price and the buyer profile.
A district-level count for one quarter has limits. A few projects trading in the quarter could shift the median up or down. The data does not break the figure down by project, age or floor level, so it cannot tell you whether the mix changed from a year ago. The y-o-y change is a comparison of two quarterly medians, not a like-for-like price change on the same homes. It points to a slightly higher median than a year earlier, and no more than that. Like every figure here, it is indicative and drawn from recorded transactions.
| Item | Value |
|---|---|
| Sales in the quarter | 66 |
| Median price | S$1,314,000 |
| Median per area | S$1,379 psf |
| Median size | 942 sqft |
| Median price a year earlier | S$1,280,000 |
| Change | +2.7% |
Buying at the median means cash, CPF and stamp duty are all due before the loan starts
Now the upfront bill. Stamp duty on the purchase is $37,160, all of it buyer's stamp duty. Additional buyer's stamp duty is $0 at 0% for this profile. Minimum cash is $65,700. A further $262,800 can be paid in CPF or cash. Add the stamp duty to those two lines and the total before the loan is $365,660. The loan limit is $985,500, which is 75.0% of the price. We find it easier to read these pieces one at a time. Stamp duty sits on top of the price. The minimum cash and the CPF-or-cash line together cover the part of the price the loan leaves over.
The table below stops at the day of purchase. It holds no mortgage payments and no running costs. The costs going in for the five-year hold include stamp duty and fees, so the two tables overlap rather than add together. We keep them apart because each answers a different question: what leaves your accounts at completion, and what the home costs to hold over time. The CPF-or-cash line is the only one with that flexibility.
| Item | Amount |
|---|---|
| Price (median of the quarter's sales) | S$1,314,000 |
| Buyer's stamp duty | S$37,160 |
| Additional buyer's stamp duty (0%) | S$0 |
| Stamp duty in total | S$37,160 |
| Maximum loan (75.0% of price) | S$985,500 |
| Minimum cash | S$65,700 |
| CPF or cash | S$262,800 |
| Total before the loan (stamp duty, cash, CPF or cash) | S$365,660 |
The loan-to-value limit, not income, sets how much the bank can lend
Three limits can cap a loan, and the engine checks each one. The loan-to-value limit allows $985,500, using the 75% cap that applies to a first loan over 25 years. The TDSR limit allows $1,875,580 at the stated income. The MSR does not apply to a private home. So the binding limit is the loan-to-value limit. In this example, income is not what holds the loan back. A household with a lower income could see a different picture, and the table below covers only this one profile.
Now the monthly cost. The instalment is $4,673 at 3%, or 26.0% of the stated income. At the 4% stress rate used for the TDSR test, it is $5,202. Both figures assume a 25-year bank loan at the full limit. The 3% rate is an assumption set in the example, not a quoted lender rate. The table does not model rate changes over the 25 years. The instalment share of income is measured only against the income we gave the buyer, so another household would see a different share.
| Item | Value |
|---|---|
| Loan type | bank loan |
| Tenure | 25 years |
| Loan-to-value cap | 75% (loan number 1, 75% LTV over 25 years) |
| Loan allowed by LTV | S$985,500 |
| Loan allowed by TDSR | S$1,875,580 |
| Loan allowed by MSR | not applicable |
| Binding limit | the loan-to-value limit |
| Monthly instalment at 3% | S$4,673 |
| Monthly instalment at the 4% stress rate | S$5,202 |
| Instalment as a share of the stated income | 26.0% |
Five years of holding the home adds up to $235,643 in costs
The hold-cost table adds four pieces. Interest is the largest at $137,558. Property tax and maintenance over the five years come to $25,740. Costs going in, which include stamp duty and fees, are $40,430. Costs coming out are $31,915. The total cost of the hold is $235,643. We think the split is the useful part here. Most of the five-year cost is interest on the loan, and the tax and upkeep lines are much smaller. The example counts no rental income, so the figures show cost only and not any offset.
The engine also reports a break-even. The price would need to rise 18.3% over the five years to cover the total. That is a threshold, not a projection, and nothing in the data says whether the district will reach it. The example rests on stated assumptions. It sells after five years at today's indicative mid value. The seller pays 2% commission and $3,000 in legal fees, plus 9% GST. Mortgage interest follows a standard amortisation schedule at 3%. Property tax uses an assumed annual value of $35,700, and maintenance follows the engine's configured norm.
| Item | Amount |
|---|---|
| Costs going in (stamp duty, fees) | S$40,430 |
| Interest over five years | S$137,558 |
| Property tax and maintenance over five years | S$25,740 |
| Costs coming out | S$31,915 |
| Total cost of the hold | S$235,643 |
Stamp duty on the same home swings widely by buyer profile
Last, we ran the same price through four buyer profiles. Buyer's stamp duty is $37,160 in every row. What changes is the additional buyer's stamp duty. A Singapore citizen buying a first home pays $0 at 0%, so the total stays at $37,160. A Singapore citizen buying a second home pays $299,960 in total, with ABSD at 20%. A permanent resident buying a first home pays $102,860 in total, with ABSD at 5%. A foreigner pays $825,560 in total, with ABSD at 60%. The gap between the first and last rows is large, and it comes entirely from the profile.
The loan limit differs too. The LTV cap is 75.0% for the first-home citizen, the permanent resident and the foreigner. It is 45.0% for the second-home citizen. We have not worked out loan sizes for the other profiles, so the table shows only the cap. With the price, district and rules version held fixed, the differences between rows come from the profile alone. The table below also gives the ABSD in dollars: $262,800 for the second-home citizen, $65,700 for the permanent resident and $788,400 for the foreigner.
| Buyer | BSD | ABSD rate (%) | ABSD | Total | LTV cap (%) |
|---|---|---|---|---|---|
| Singapore citizen, first home | S$37,160 | 0.0 | S$0 | S$37,160 | 75.0 |
| Singapore citizen, second home | S$37,160 | 20.0 | S$262,800 | S$299,960 | 45.0 |
| Permanent resident, first home | S$37,160 | 5.0 | S$65,700 | S$102,860 | 75.0 |
| Foreigner | S$37,160 | 60.0 | S$788,400 | S$825,560 | 75.0 |
This is one quarter, one district and one buyer profile. The figures leave open how the district's median will move, and whether the count of sales stays similar. In the 3Q2026 data, we will look at the number of sales and the median against the 2Q2026 level. The rules applied here are versioned. The newest took effect on 2025-07-04, and the engine checked the rates against IRAS and MAS publications on 2026-09-18. Rules change from round to round, and each change reshapes the tables above.
A single headline number rarely says much on its own. A median, a stamp duty bill or a break-even gains meaning from how it sits beside the others and the direction the market is taking from one quarter to the next. We will keep reading District 27 that way.
Method: an illustrative example, not a real purchase. The price is the median of the quarter's recorded sales named. The buyer is a Singapore citizen first-time owner-occupier aged 35. The stated household income is S$18,000 a month, with no other debt. The loan is the maximum, over 25 years at 3%. Stamp duty, loan limits, instalments and the five-year hold cost are computed by this site's position engine under the rules recorded as in force for the quarter. The rule versions used are bsd 2023-02-15, absd 2023-04-27, ssd 2025-07-04, ltv 2024-08-20, tdsr 2022-09-30, property_tax 2025-01-01, costs 2020-01-01. Further assumptions: sale at today's indicative mid value after 5 years. Seller pays 2% commission and S$3,000 legal fees, plus 9% GST. Mortgage interest from a standard amortisation schedule at the given rate. Loan of S$985,500 (75% of the price), the maximum available. Property tax on an assumed annual value of S$35,700 (85% of market rent). Maintenance at the configured norm. Rates are versioned data in config/rules.yaml, checked against IRAS and MAS publications on 2026-09-18. The newest version applied here took effect 2025-07-04. Rules change with each cooling-measure round. Private figures are from URA Data Service caveats, HDB figures from data.gov.sg resale records, both loaded weekly by this site's ingest. Medians are of the non-excluded transactions in the period named. Sales flagged by the hygiene rules (related-party transfers, bulk deals, outliers) are left out. Every figure is indicative and drawn from recorded transactions, not a formal valuation.