D'Leedon Clocked 72 Resales At A Median Of S$2,082 psf — But It Still Sits 7.7% Below Its Own District
Published 30 Sept 2026 · D'Leedon
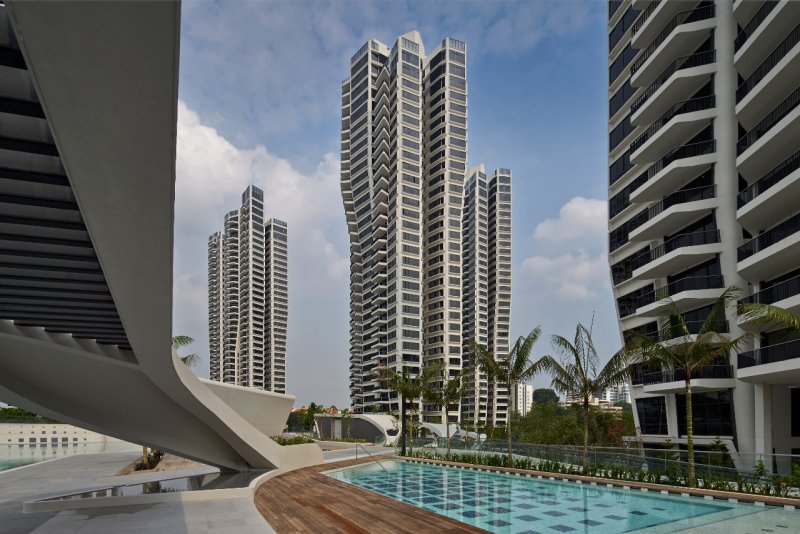
A big project with a lot of transactions is one of the few places in the private market where you can actually see a trend rather than guess at one. D'Leedon gives us 72 resales in four quarters and over a hundred rental contracts a quarter. The tension is that all that volume has produced remarkably little price movement, and the project still trades below the District 10 median.
According to URA caveat data and URA rental contracts, D'Leedon is a 99-year leasehold condo in District 10 with 83 years of lease left. It recorded 72 resales over 3Q2025 to 2Q2026 at a median of S$2,082 psf. Across the eight quarters shown, the quarterly median moved +2.2%, from S$2,039 psf in 3Q2024 on 13 sales to S$2,084 psf in 2Q2026 on 21 sales. Over the same four-quarter window the District 10 resale median was S$2,256 psf from 1,005 sales, putting D'Leedon at -7.7% against it.
Eight quarters of data have moved the median by just 2.2%
The quarter-by-quarter table is the flattest one we have looked at in a while. From 3Q2024 to 2Q2026, the median psf sits in a band between S$2,039 psf and S$2,106 psf. The high point is 1Q2026 at S$2,106 psf on 17 sales; the low is the first quarter in the window. Nothing in between looks like a step change.
What does move is the spread. In 3Q2024 the 25th and 75th percentiles were S$1,972 psf and S$2,096 psf. By 2Q2026 they were S$1,997 psf and S$2,205 psf. The upper quartile has stretched while the lower one has barely budged. That is a mix effect as much as anything, and the table cannot tell us which stacks and sizes sat in each quarter.
Volume is also uneven. 2Q2025 recorded only 9 resales, against 21 in 2Q2026. A nine-sale quarter moves a median easily, so the small dip and recovery between 3Q2025 and 4Q2025 is not something we would read much into. The chart below plots the same series.
Here are the quarterly figures and the chart.
| Quarter | Resales | Median psf | 25th percentile | 75th percentile |
|---|---|---|---|---|
| Q3 2024 | 13 | S$2,039 psf | S$1,972 psf | S$2,096 psf |
| Q4 2024 | 11 | S$2,044 psf | S$1,960 psf | S$2,090 psf |
| Q1 2025 | 18 | S$2,047 psf | S$2,037 psf | S$2,099 psf |
| Q2 2025 | 9 | S$2,056 psf | S$1,988 psf | S$2,105 psf |
| Q3 2025 | 14 | S$2,096 psf | S$2,063 psf | S$2,135 psf |
| Q4 2025 | 20 | S$2,063 psf | S$2,017 psf | S$2,162 psf |
| Q1 2026 | 17 | S$2,106 psf | S$2,028 psf | S$2,155 psf |
| Q2 2026 | 21 | S$2,084 psf | S$1,997 psf | S$2,205 psf |
The largest units are the most traded, and they are not the cheapest on a psf basis
Size bands tell a clearer story than quarters here. Units of 120 sqm and above were the most traded band, with 33 resales at a median of S$3,420,000, or S$2,115 psf. That is the second-highest psf of the four bands, behind the 70 to 89 sqm band at S$2,144 psf on only 7 sales.
The usual pattern of small units carrying the highest psf does not hold cleanly at D'Leedon. The 50 to 69 sqm band, 8 resales, has the lowest median psf of the set at S$2,014 psf, on a median area of 635 sqft and a median price of S$1,314,000. The 90 to 119 sqm band, the second-busiest with 24 resales, sits at S$2,053 psf.
Two of the four bands have single-digit counts, so their medians rest on very few sales. The two bands that carry weight, 90 to 119 sqm and 120 sqm and above, are 62 psf apart. That suggests the larger stacks are holding their per-area pricing rather than being discounted for absolute quantum, at least over these four quarters.
The breakdown by size band is below.
| Size band | Resales | Median area | Median price | Median psf |
|---|---|---|---|---|
| 50 to 69 sqm | 8 | 635 sqft | S$1,314,000 | S$2,014 psf |
| 70 to 89 sqm | 7 | 786 sqft | S$1,685,000 | S$2,144 psf |
| 90 to 119 sqm | 24 | 1,146 sqft | S$2,385,444 | S$2,053 psf |
| 120 sqm and above | 33 | 1,615 sqft | S$3,420,000 | S$2,115 psf |
Rents per square foot have risen while median monthly rent has fallen
The rental table pulls in two directions at once, which is worth slowing down on. Median rent per square foot went from 5.5 in 3Q2025 to 5.7 in 2Q2026. Over the same stretch, median monthly rent fell from S$6,200 to S$5,800. Both figures are medians of the same contracts.
The only way both happen together is a shift in the mix of units being leased. Smaller units rent at a higher psf and a lower monthly figure, so a quarter with more of them can push the two medians apart. The data does not break rentals down by size, so we cannot confirm that here, but it points that way.
Contract counts also moved, from 140 in 3Q2025 down to 92 in 1Q2026 and back to 111 in 2Q2026. Against the four-quarter resale median, the 2Q2026 rental median of S$5.68 psf a month works out to a gross yield of about 3.2% on our own engine's measure. That is an indicative figure from recorded contracts and caveats, not a valuation.
The quarterly rental record is below.
| Quarter | Contracts | Median rent (S$ psf a month) | Median monthly rent |
|---|---|---|---|
| Q3 2025 | 140 | 5.5 | S$6,200 |
| Q4 2025 | 105 | 5.4 | S$6,200 |
| Q1 2026 | 92 | 5.5 | S$6,050 |
| Q2 2026 | 111 | 5.7 | S$5,800 |
Within a kilometre, tenure separates the pricing more than distance does
The eight projects with enough resales nearby span S$1,947 psf to S$2,870 psf. Leedon Green, 445 m away and freehold, sits at the top on 6 resales at S$2,870 psf. Leedon Residence, 437 m away, recorded 13 resales at S$2,828 psf. Both are closer to D'Leedon than most of the list.
At the other end, Duchess Crest is the only other 99-year leasehold project in the set. It recorded 13 resales at S$1,947 psf from 948 m away. D'Leedon's own four-quarter median of S$2,082 psf sits between that and the freehold cluster around S$2,155 psf to S$2,366 psf.
Distance clearly is not the sorting variable. Sommerville Park at 561 m is S$2,189 psf; Viz At Holland at 918 m is S$2,021 psf; the landed transactions on Coronation Road West, 8 of them, come in at S$2,200 psf. Several of these counts are under ten, so the medians are thin. Still, the split between leasehold and freehold is the one line you can draw across the table.
The neighbouring projects are below.
| Project | Tenure | TOP | Distance | Resales | Median psf |
|---|---|---|---|---|---|
| Sommerville Park | freehold | — | 561 m | 15 | S$2,189 psf |
| Duchess Crest | 99-year leasehold | — | 948 m | 13 | S$1,947 psf |
| Leedon Residence | freehold | — | 437 m | 13 | S$2,828 psf |
| Parvis | freehold | — | 881 m | 11 | S$2,366 psf |
| Landed, Coronation Road West | freehold | — | 967 m | 8 | S$2,200 psf |
| The Cornwall | freehold | — | 604 m | 7 | S$2,155 psf |
| Viz At Holland | freehold | — | 918 m | 7 | S$2,021 psf |
| Leedon Green | freehold | — | 445 m | 6 | S$2,870 psf |
The top five resales all cleared S$4M, and the highest price is not the highest psf
The largest transactions are a useful check on whether the upper quartile is being set by a handful of deals. The highest resale price in the window was S$4,800,000 in 2Q2026, a 2,433 sqft unit in the 26-30 storey range. On a per-area basis that is S$1,973 psf, below the project's four-quarter median.
The same holds further down the list. The 4Q2025 sale at S$4,300,000 came in at S$1,893 psf, the lowest psf of the five. The highest psf among the top sales is S$2,106 psf, from the 1Q2026 deal at S$4,375,000 on 2,077 sqft. So the biggest cheques here are being written for area, not for a per-square-foot premium.
Four of the five are 2,000 sqft and up, and three are in the 26-30 storey range. Five transactions is not a trend. But it does mean the stretched 75th percentile in 2Q2026 is unlikely to be coming from these particular sales.
The largest resales in the window are below.
| Quarter | Storey range | Area | Price | Per sqft |
|---|---|---|---|---|
| Q2 2026 | 26-30 | 2,433 sqft | S$4,800,000 | S$1,973 psf |
| Q1 2026 | 21-25 | 2,077 sqft | S$4,375,000 | S$2,106 psf |
| Q4 2025 | 26-30 | 2,271 sqft | S$4,300,000 | S$1,893 psf |
| Q4 2025 | 26-30 | 2,228 sqft | S$4,280,000 | S$1,921 psf |
| Q2 2026 | 11-15 | 2,024 sqft | S$4,100,000 | S$2,026 psf |
Our own estimate has a median error of 3.9% at this project
Because we publish estimates, we test them. As of 4Q2025, our estimate for D'Leedon was checked against 62 later sales at the project. The median error came out at 3.9%, with 37% of those sales landing inside the stated range.
That is worth reading plainly. A median error of 3.9% means half the tested sales were closer than that and half were further away. The 37% hit rate on the range tells you the stated band is narrower than the actual spread of transacted prices at D'Leedon, which the widening quartiles in the quarterly table already hinted at.
Every figure in this piece comes from recorded transactions, with the caveat data from URA and the yield computed by our engine. None of it is a formal valuation of any home.
In pictures
The open question is the rental mix. Median monthly rent has come down three quarters in a row while psf rent has gone up, and the data as published cannot separate those two effects by unit size. The next quarter's contracts will show whether S$5,800 was a mix artefact or the start of a lower band. On the sales side, the thing to track is the 75th percentile, which reached S$2,205 psf in 2Q2026 while the median stayed near S$2,084 psf. If that gap holds through another 20-sale quarter, it is a real change in what is transacting.
One number from one quarter rarely settles anything at a project this size. D'Leedon's own median has barely moved in two years, yet the spread beneath it has widened, the rental figures have split in two directions, and the gap to District 10 is still 7.7%. Read any one of those alone and you would get a different picture. Read them together and the interesting part is how little the headline has moved while the detail underneath keeps shifting.
Method: URA resale caveats at the project (developer sales and sub-sales excluded) by the quarter of the sale month. Size bands by caveated floor area. Rents are URA rental contracts at the project, and the gross yield is the mean of the quarterly median rents per square foot, annualised, over the four-quarter resale median per square foot, before any cost. Lease left is the tenure less the years since the lease started, as recorded. The estimate accuracy is this site's backtest: the engine run as of the quarter named, compared with the sales since. Private figures are from URA Data Service caveats, HDB figures from data.gov.sg resale records, both loaded weekly by this site's ingest. Medians are of the non-excluded transactions in the period named. Sales flagged by the hygiene rules (related-party transfers, bulk deals, outliers) are left out. Every figure is indicative and drawn from recorded transactions, not a formal valuation.