Ang Mo Kio's Median HDB Resale Psm Slipped 0.6% Over The Year — But 35 Flats Still Crossed S$1 Million
Published 20 Oct 2026
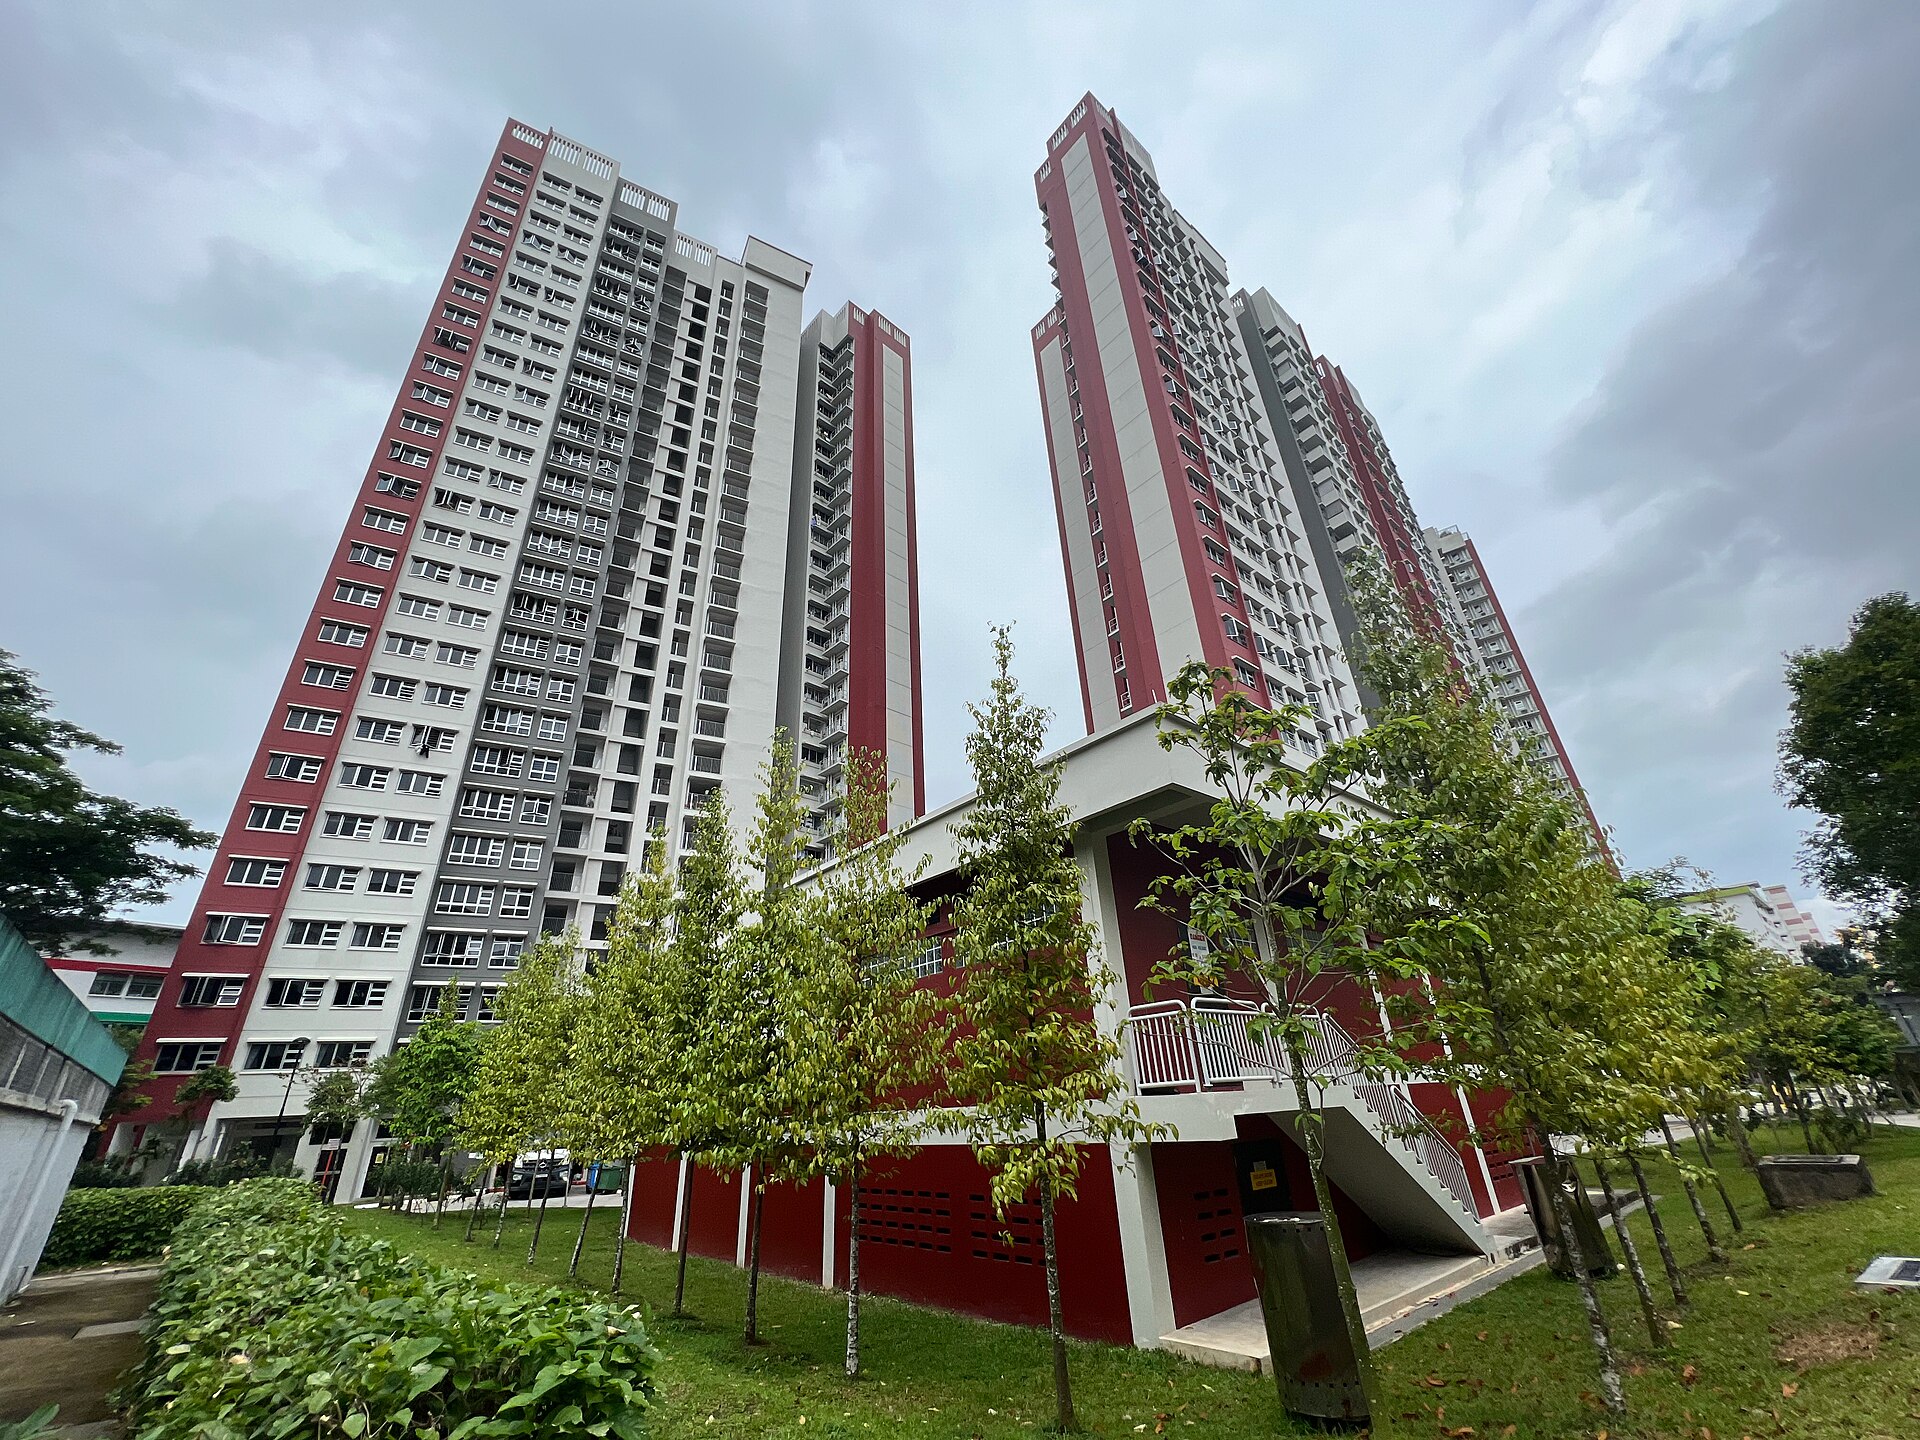
A town's median price can rise while its median psm falls. Both happened in Ang Mo Kio in 2Q2026. The gap between those two numbers is the story of the quarter. Flat type mix sits underneath it, and we'll work through that below.
According to HDB resale records published on data.gov.sg, Ang Mo Kio recorded 228 resales in 2Q2026. The median was S$6,260 psm. The median price was S$514,000. Against 2Q2025, that is -0.6% on psm and +3.8% on price. The town saw 242 sales a year earlier. Island-wide, the HDB resale median psm moved -0.4% over the same year. On a per-area basis, then, Ang Mo Kio moved almost exactly with the island. The price line is where it parted ways.
The town's median psm has gone sideways for about a year, after climbing through 2024
We pulled eight quarters of medians for the town. The series starts at S$6,068 psm in 3Q2024, on 304 sales. It climbs through 4Q2024 and 1Q2025. By 2Q2025 it reaches S$6,299 psm. Then it flattens. 3Q2025 came in at S$6,280 psm. 4Q2025 came in at S$6,285 psm. The high point of the run is 1Q2026, at S$6,385 psm. 2Q2026 then reads S$6,260 psm. Across the full eight quarters, the town's median psm has moved +3.2%.
A median psm is a middle number, not an index. Volumes shift around it. Sales ranged from 186 in 4Q2025 to 304 in 3Q2024. Thinner quarters can move a median without any broad change across the town. The chart below plots the series with the count behind each point. The step down from 1Q2026 to 2Q2026 is one quarter of movement. On its own it does not settle a direction.
The top of the market got busier even as the middle eased
The quarterly table below carries a second column worth reading beside the median. It counts resales at S$1 million or more. In 2Q2026 there were 35. A year earlier, in 2Q2025, there were 20. The peak of the run is 40, in 1Q2026, on 200 sales. The low is 12, in 4Q2025. In 3Q2024 there were 24, on the largest sales count in the series.
The two columns measure different things. The million-dollar count is a raw tally of transactions above a fixed price. The median summarises all 228 sales in the quarter. A town can add more large, high-floor flats at the top and still show a softer middle. These records show the counts. They do not show what sat behind them.
| Quarter | Median psm | Median price | Sales | At S$1m or more |
|---|---|---|---|---|
| Q3 2024 | S$6,069 psm | S$480,000 | 304 | 24 |
| Q4 2024 | S$6,148 psm | S$470,000 | 230 | 14 |
| Q1 2025 | S$6,246 psm | S$480,000 | 252 | 14 |
| Q2 2025 | S$6,299 psm | S$495,444 | 242 | 20 |
| Q3 2025 | S$6,280 psm | S$520,888 | 259 | 30 |
| Q4 2025 | S$6,285 psm | S$480,000 | 186 | 12 |
| Q1 2026 | S$6,385 psm | S$549,500 | 200 | 40 |
| Q2 2026 | S$6,260 psm | S$514,000 | 228 | 35 |
Not every flat type moved in the same direction this year
The flat-type table splits the year-on-year change three ways. 3-room flats recorded a median of S$425,000 in 2Q2026, on 107 sales. That is -3.4% against S$440,000 a year earlier. 4-room flats recorded S$652,400, on 78 sales. That is +8.7% from S$600,000. 5-room flats recorded S$1,000,000, on 39 sales. That is +13.6% from S$880,000.
On a per-area basis the steps are wide. 3-room medians sit at S$5,940 psm. 4-room sit at S$6,667 psm. 5-room sit at S$8,436 psm. The spread between the smallest and largest type is the widest gap in the table.
One caveat on reading the town figure. 3-room flats were the largest group this quarter, at 107 sales. Yet the town median price still rose 3.8% on the year. A rising median price next to a falling median psm points to mix. Different flat types sold in different shares across the two quarters. These figures cannot separate that mix effect from pricing within each type.
| Flat type | Median price Q2 2026 | Median psm | Sales | Median price Q2 2025 | Change |
|---|---|---|---|---|---|
| Ang Mo Kio 3-room | S$425,000 | S$5,940 psm | 107 | S$440,000 | -3.4% |
| Ang Mo Kio 4-room | S$652,400 | S$6,667 psm | 78 | S$600,000 | +8.7% |
| Ang Mo Kio 5-room | S$1,000,000 | S$8,436 psm | 39 | S$880,000 | +13.6% |
All five of the quarter's highest prices were 5-room flats
The highest recorded price in Ang Mo Kio was S$1,320,000. That was at Blk 455B Ang Mo Kio St 44, in the 31 to 33 storey range. The flat is 113 sqm, at S$11,681 psm, with 91 years of lease left. Second on the list is Blk 260B Ang Mo Kio St 21, at S$1,300,000. It is also 113 sqm with 91 years left, from a lower band of 25 to 27.
The rest of the table sits close together. Blk 310A Ang Mo Kio Ave 1 recorded S$1,260,000 for 119 sqm. Blk 588B Ang Mo Kio St 52 recorded S$1,250,000 for 117 sqm. Blk 228A Ang Mo Kio St 23 recorded S$1,220,000, with 94 years of lease left. Lease left across the five runs from 84 to 94 years. Every line here is a recorded transaction price. None of them is a valuation of a home.
| Block | Flat type | Storey range | Area | Price | Per sqm | Lease left (years) |
|---|---|---|---|---|---|---|
| Blk 455B Ang Mo Kio St 44 | 5-room | 31 TO 33 | 113 sqm | S$1,320,000 | S$11,681 psm | 91 |
| Blk 260B Ang Mo Kio St 21 | 5-room | 25 TO 27 | 113 sqm | S$1,300,000 | S$11,504 psm | 91 |
| Blk 310A Ang Mo Kio Ave 1 | 5-room | 19 TO 21 | 119 sqm | S$1,260,000 | S$10,588 psm | 86 |
| Blk 588B Ang Mo Kio St 52 | 5-room | 16 TO 18 | 117 sqm | S$1,250,000 | S$10,684 psm | 84 |
| Blk 228A Ang Mo Kio St 23 | 5-room | 16 TO 18 | 113 sqm | S$1,220,000 | S$10,796 psm | 94 |
What these figures leave open is the mix question. We can see that 3-room sales were the largest group, and that 5-room medians rose most. We cannot see, from this data, how the shares shifted against 2Q2025. The million-dollar count also moved a lot across the run, from 12 in 4Q2025 to 40 in 1Q2026. Counts that swing that far in two quarters are worth tracking in the 3Q2026 records. The other thing to follow is whether the median psm holds near S$6,260 psm or returns to the 1Q2026 level.
A single quarter's median rarely explains much by itself. It is one middle number drawn from a few hundred transactions, with mix and volume moving under it. What it is good for is placing the quarter in a longer line. Read next to the eight-quarter series, the flat-type split and the top of the market, the 2Q2026 reading starts to make sense. Read alone, it is just a number that went down 0.6%.
Method: HDB resale records grouped by town and by the quarter of the sale month. Medians are of price and of price per square metre. Flat types with fewer than five sales in the quarter are omitted from the breakdown. Lease left is rounded to whole years as at the sale. Private figures are from URA Data Service caveats, HDB figures from data.gov.sg resale records, both loaded weekly by this site's ingest. Medians are of the non-excluded transactions in the period named. Sales flagged by the hygiene rules (related-party transfers, bulk deals, outliers) are left out. Every figure is indicative and drawn from recorded transactions, not a formal valuation.