Sembawang's Resale Median Is Down 3.9% Over The Year To S$6,683 Psm — But It Has Risen For Two Straight Quarters
Published 26 Sept 2026
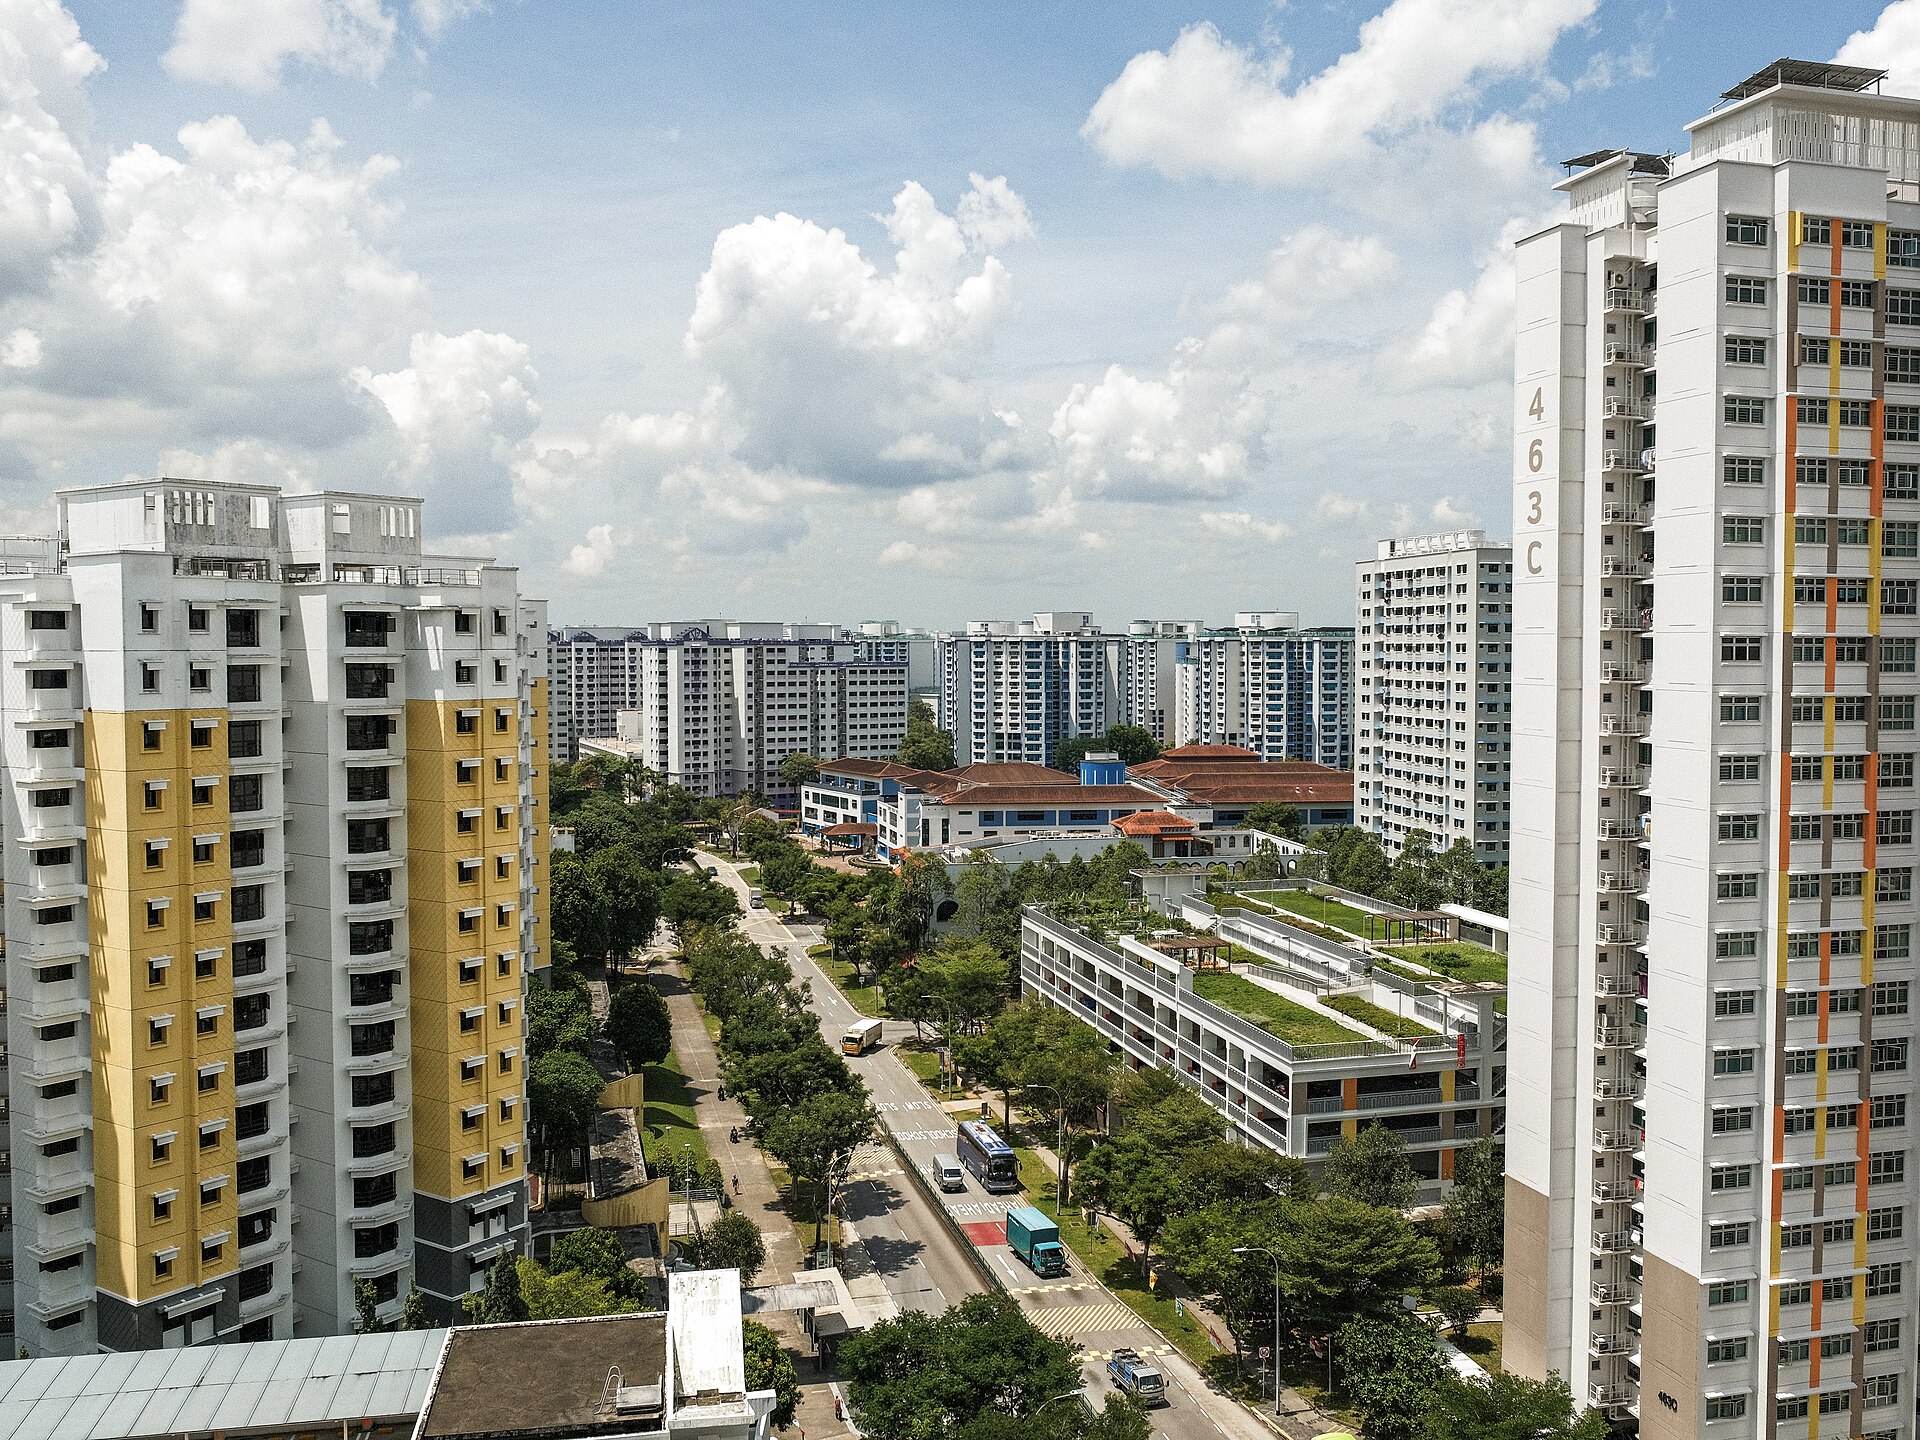
Sembawang's resale median fell over the year. It also rose over the quarter. Both are true, and both come from the same set of records. The year-on-year drop is the larger number. But the last two quarters point the other way. That gap is the most interesting thing in this quarter's data. Volume adds another layer to it. Far fewer flats changed hands than a year ago, which makes the median a thinner reading than it was.
According to data.gov.sg HDB resale records, Sembawang recorded 176 resales in 2Q2026. The median was S$6,683 psm and the median price was S$585,000. Against 2Q2025, that is -3.9% on psm and -7.1% on price. That earlier quarter had 334 sales. Island-wide, the HDB resale median psm moved -0.4% over the same year. Stretch the window back further and the direction flips. Since 3Q2024 the town's median psm has moved +10.9%, from S$6,026 psm on 244 sales. Every figure here is indicative and drawn from recorded transactions.
The median psm has risen for two quarters even as the median price fell
Start with the quarterly table. The psm median in 2Q2026 sits above S$6,515 psm in 1Q2026 and S$6,452 psm in 4Q2025. So that line has moved up twice in a row. The median price did not follow. It came in at S$585,000, down from S$606,500 in the prior quarter. The two measures can move apart. A price median responds to the size of the flats that sold. A psm median does not, in the same way. A quarter with more small units can lift psm and pull the price median down. The table does not record flat mix on its own, so it cannot settle that point here.
Volume is the other thing that stands out. Sembawang recorded 176 resales in 2Q2026, against 334 in 2Q2025. That 176 is the lowest count in the eight quarters shown. Both 1Q2025 and 2Q2025 sat at 334, the highest in the run. A smaller count makes a median easier to move. One unusual cluster of sales carries more weight in it. That matters when you set a 176-sale quarter beside a 334-sale quarter. The y-o-y change is real. It simply rests on very different sample sizes at each end of the comparison.
Here is the full run of quarters.
| Quarter | Median psm | Median price | Sales | At S$1m or more |
|---|---|---|---|---|
| Q3 2024 | S$6,026 psm | S$577,500 | 244 | 0 |
| Q4 2024 | S$6,645 psm | S$596,500 | 262 | 0 |
| Q1 2025 | S$6,882 psm | S$625,000 | 334 | 0 |
| Q2 2025 | S$6,951 psm | S$630,000 | 334 | 0 |
| Q3 2025 | S$6,652 psm | S$620,000 | 288 | 0 |
| Q4 2025 | S$6,452 psm | S$600,000 | 205 | 0 |
| Q1 2026 | S$6,515 psm | S$606,500 | 230 | 0 |
| Q2 2026 | S$6,683 psm | S$585,000 | 176 | 0 |
The eight-quarter line peaks in 2Q2025 and has been climbing back since the end of last year
The chart below tracks the same medians as a line. The high point is 2Q2025 at S$6,951 psm, on 288 fewer sales than... to be exact, on 334 sales. Three quarters of softer readings followed. The lowest of those was 4Q2025 at S$6,452 psm. That is still above the starting point of the run, 3Q2024 at S$6,026 psm on 244 sales. From that first quarter to this one, the town's median psm has moved +10.9%. So the y-o-y fall and the two-year rise sit in the same series.
The counts underneath the line are worth reading alongside it. They climb from 244 in 3Q2024 to 334 in 1Q2025 and 2Q2025. Then they fall through 288, 205 and 230. The latest quarter is the thinnest of the eight. The chart shows the level of the median in each quarter. It does not show what was sold. A shift towards smaller flats, or towards newer blocks, would show up in the psm line without any single flat changing price.
Not every flat type is moving in the same direction
The flat-type table splits 2Q2026 against 2Q2025. Two types are up on the year. The 2-room median is S$385,000, +1.8%. The executive median is S$757,500, +2.0%. Three are down. The 3-room is at S$511,500, -1.6%. The 4-room is at S$602,500, -5.9%. The 5-room is at S$650,000, -6.6%. So the town-level fall is not spread evenly. The larger declines sit in the two types that make up the bulk of the quarter's sales.
Counts matter here. The 4-room recorded 74 sales, the most of any type. The 5-room recorded 39. The two types that rose are the two thinnest, with 21 sales for the 2-room and 14 for the executive. A 14-sale median can swing on a handful of transactions. We would not read much into a 2.0% move on that base.
The psm column runs the other way to the price column. The 2-room median is S$8,450 psm, the highest of the five. The 5-room is S$5,545 psm, the lowest. The executive sits at S$5,623 psm. That ordering is normal for HDB resale data.
| Flat type | Median price Q2 2026 | Median psm | Sales | Median price Q2 2025 | Change |
|---|---|---|---|---|---|
| Sembawang 2-room | S$385,000 | S$8,450 psm | 21 | S$378,000 | +1.8% |
| Sembawang 3-room | S$511,500 | S$7,519 psm | 28 | S$520,000 | -1.6% |
| Sembawang 4-room | S$602,500 | S$6,413 psm | 74 | S$640,000 | -5.9% |
| Sembawang 5-room | S$650,000 | S$5,545 psm | 39 | S$695,888 | -6.6% |
| Sembawang executive | S$757,500 | S$5,623 psm | 14 | S$742,500 | +2.0% |
All five of the quarter's highest prices came from Canberra addresses
The top-five table is unusually concentrated. Every entry is a Canberra address. The highest recorded price was S$940,000, for an executive flat at Blk 308 Canberra Rd. It measured 141 sqm on the 10 to 12 storey range, at S$6,667 psm, with 72 years of lease left. That is the lowest psm of the five, on the largest floor area and the shortest remaining lease.
Below it sit three 5-room flats and a 4-room. Blk 128A Canberra St went at S$830,000, or S$7,345 psm, with 91 years left. Blk 126C Canberra St went at S$825,000, and Blk 101A Canberra St at S$823,000. Both have 94 years of lease left. The 4-room at Blk 132B Canberra View recorded S$828,000 on 95 sqm. That works out to S$8,716 psm in the table, the highest psm of the five.
The pattern is one of price and psm diverging at the top end. The biggest cheque was not the dearest space. Five transactions cannot describe a town of 176 sales. They do show where the quarter's largest figures were recorded.
| Block | Flat type | Storey range | Area | Price | Per sqm | Lease left (years) |
|---|---|---|---|---|---|---|
| Blk 308 Canberra Rd | executive | 10 TO 12 | 141 sqm | S$940,000 | S$6,667 psm | 72 |
| Blk 128A Canberra St | 5-room | 10 TO 12 | 113 sqm | S$830,000 | S$7,345 psm | 91 |
| Blk 132B Canberra View | 4-room | 07 TO 09 | 95 sqm | S$828,000 | S$8,716 psm | 94 |
| Blk 126C Canberra St | 5-room | 13 TO 15 | 113 sqm | S$825,000 | S$7,301 psm | 94 |
| Blk 101A Canberra St | 5-room | 07 TO 09 | 116 sqm | S$823,000 | S$7,095 psm | 94 |
No Sembawang flat has crossed S$1 million in any of these eight quarters
The last column of the quarterly table stays at zero throughout. There were no resales at S$1 million or more in 2Q2026, and none in 2Q2025 either. The same holds for every quarter back to 3Q2024. The quarter's top recorded price stopped short of that mark. So the million-dollar story that shapes headlines in other towns does not appear in Sembawang's records at all.
The island comparison is the other piece of context. The island-wide HDB resale median psm moved -0.4% over the year to 2Q2026. Sembawang's psm median moved -3.9% over the same period. The town fell by more than the national figure. What the data does not tell us is how much of that gap comes from mix. With 176 sales against 334, the composition of the two quarters may simply differ.
A few things stay open. The psm median has now risen twice in a row, but the price median has not. Whether those two lines converge again will show up in 3Q2026 records. Volume is the other number to follow. At 176 sales, this is the thinnest quarter in the run, and thin quarters move medians more easily. The flat-type table is where the detail sits. The 4-room and 5-room medians carry most of the town's transactions, and both are down on the year. The 2-room and executive readings are built on far fewer sales.
One headline percentage rarely settles much on its own. Sembawang is -3.9% on the year and +10.9% since 3Q2024, from the same series. Which figure feels truer depends only on where you start counting. We would read this quarter as one point in a line, not as a verdict on the town.
Method: HDB resale records grouped by town and by the quarter of the sale month. Medians are of price and of price per square metre. Flat types with fewer than five sales in the quarter are omitted from the breakdown. Lease left is rounded to whole years as at the sale. Private figures are from URA Data Service caveats, HDB figures from data.gov.sg resale records, both loaded weekly by this site's ingest. Medians are of the non-excluded transactions in the period named. Sales flagged by the hygiene rules (related-party transfers, bulk deals, outliers) are left out. Every figure is indicative and drawn from recorded transactions, not a formal valuation.