Treasure At Tampines most traded private project in four quarters to 2Q2026, with 135 resales
Published 26 Sept 2026
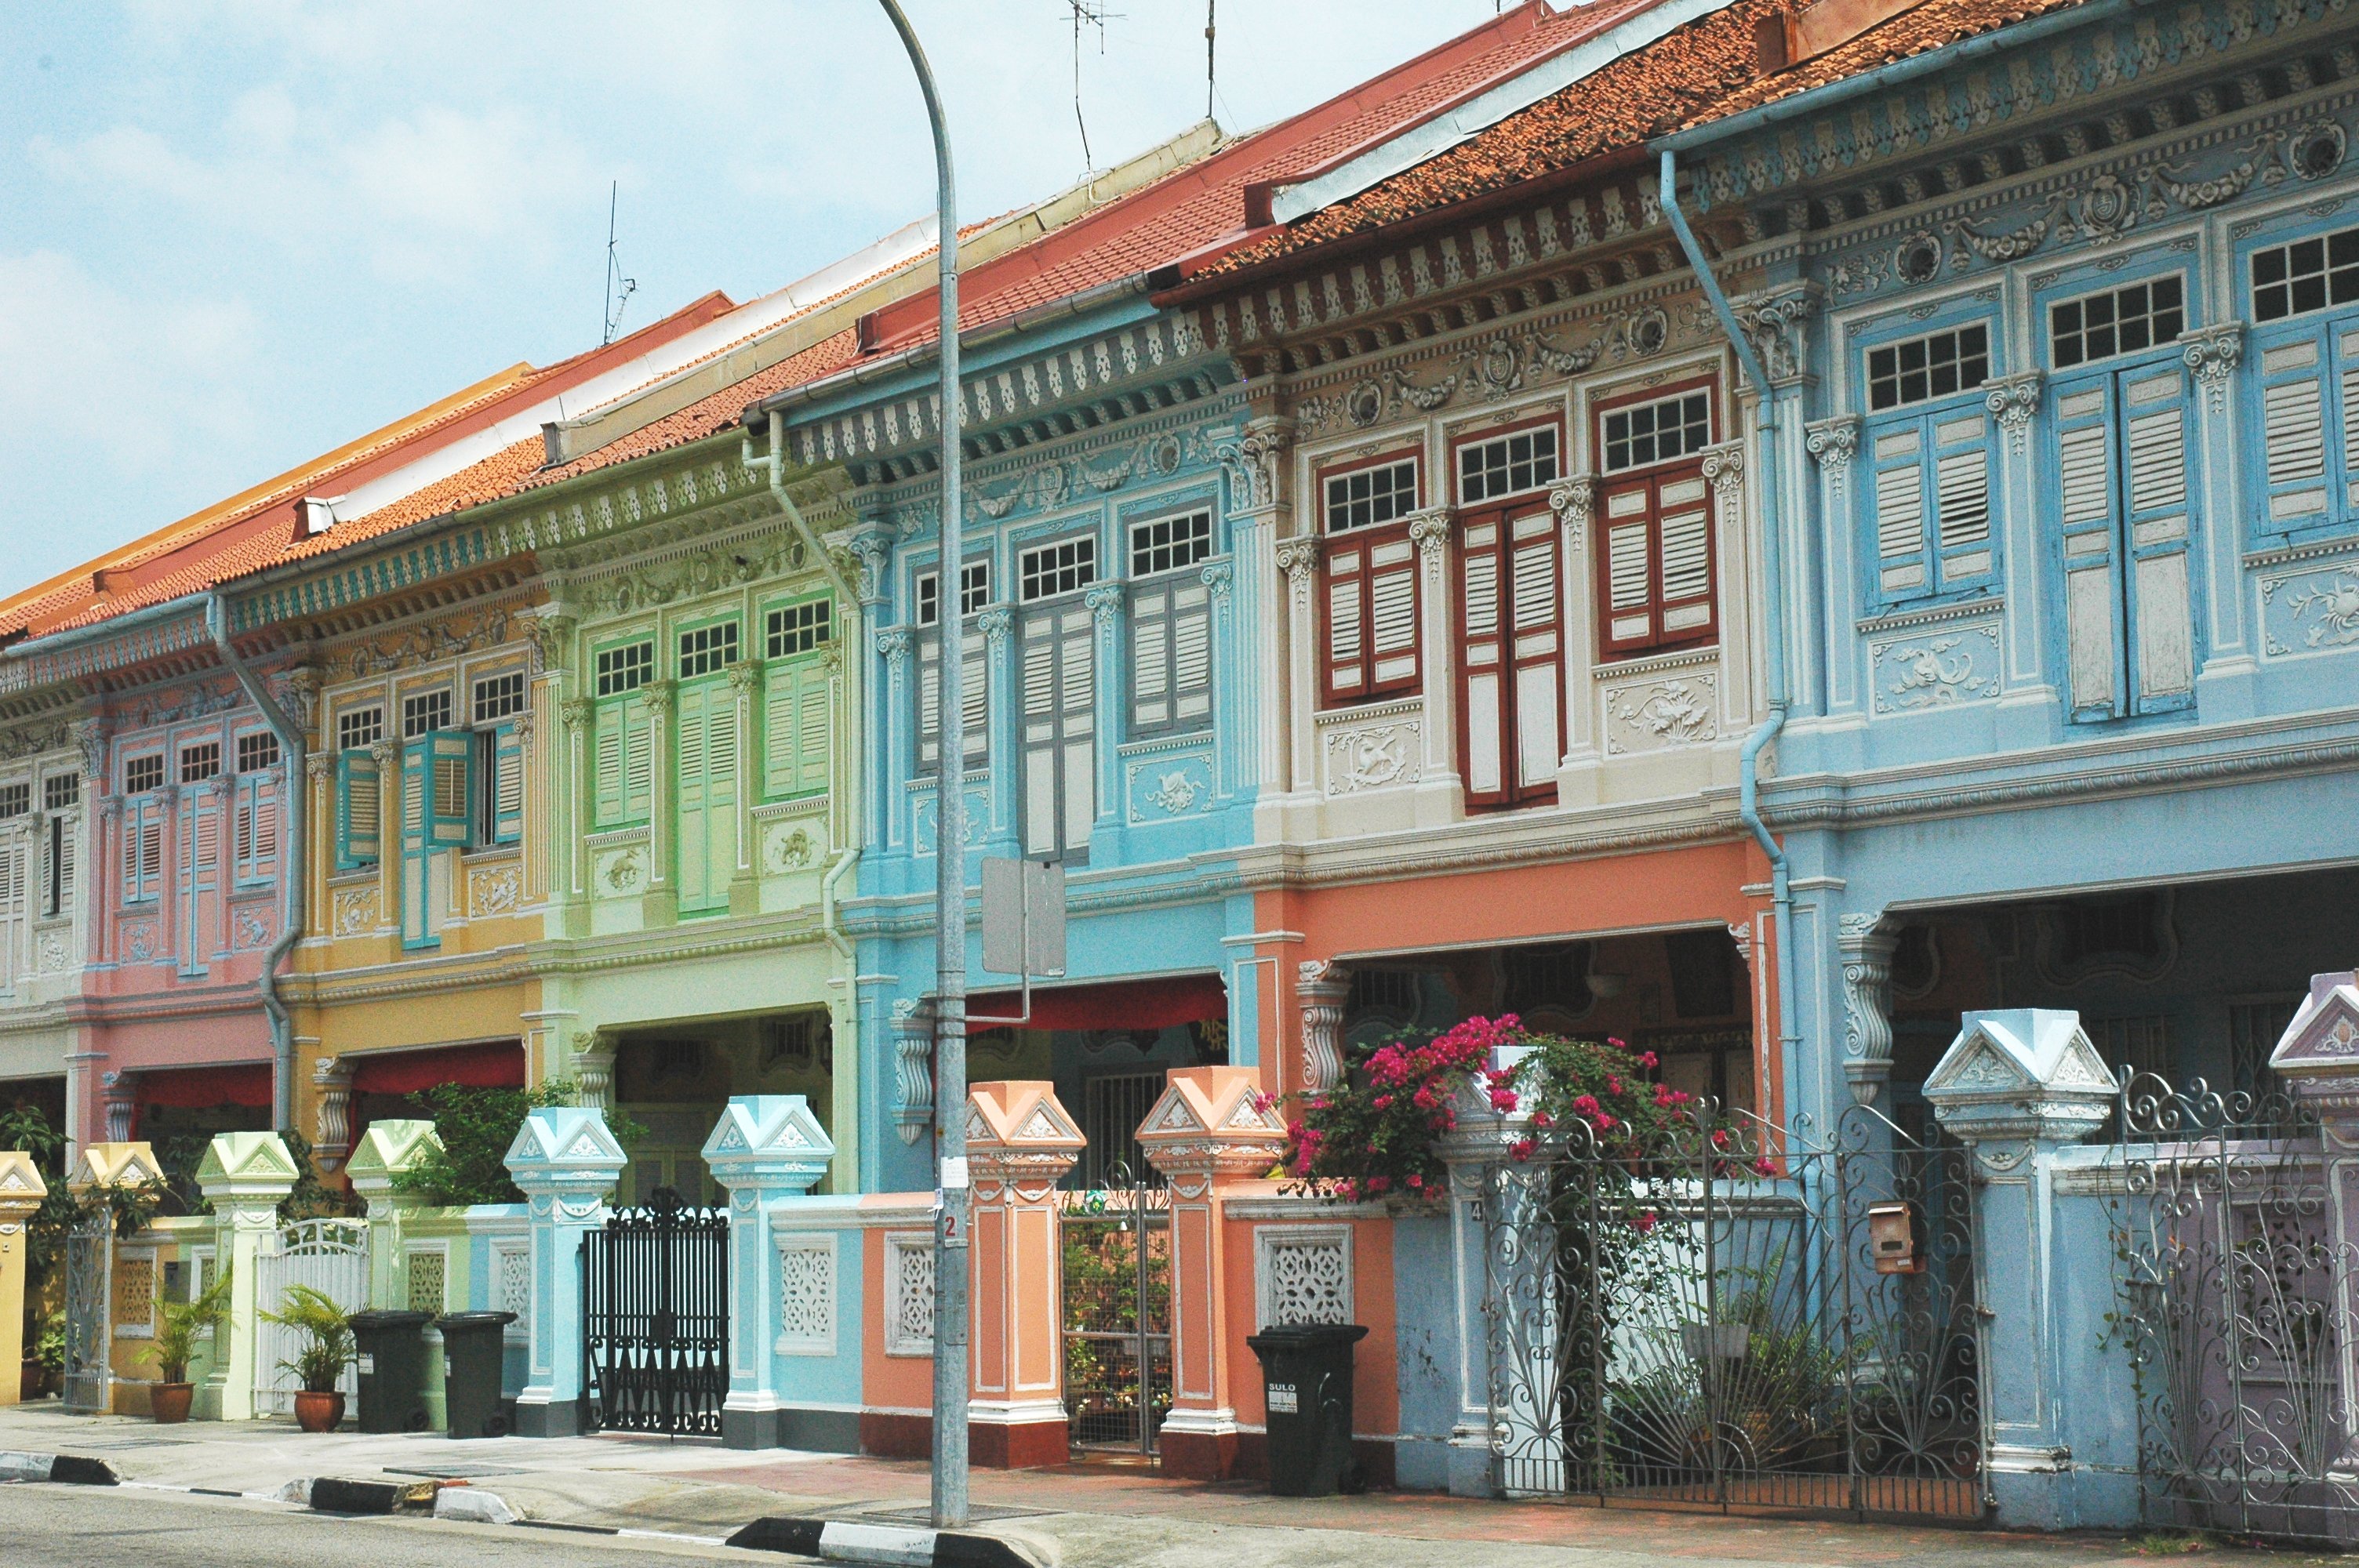
Treasure At Tampines in District 18 was the most traded private project over the four quarters to 2Q2026. It recorded 135 resales, against 215 in the four quarters before — resale volume thinned in both markets over the window.
Across Q3 2025 to Q2 2026 there were 15,328 private resales, down 5.8% from 16,271. HDB resales fell 11.1% to 23,363, based on URA Data Service caveats and data.gov.sg HDB resale records.
The 15 most traded projects made 8.5% of private resales
The 15 most traded projects together recorded 1,299 resales. That was 8.5% of all private resales in the window. Eight of them traded more than in the four quarters before, and six fewer.
Stirling Residences in District 3 came second with 116 resales, up 16.0%. Parc Esta in District 14 followed with 109, down 17.4%. The median at Treasure At Tampines rose 4.0% to S$1,806 psf.
| Project | District | Tenure | TOP | Resales Q3 2025 to Q2 2026 | Resales Q3 2024 to Q2 2025 | Change in count | Median psf now | Median psf before | Change in median |
|---|---|---|---|---|---|---|---|---|---|
| Treasure At Tampines | District 18 | 99 | — | 135 | 215 | -37.2% | S$1,806 psf | S$1,738 psf | +4.0% |
| Stirling Residences | District 3 | 99 | — | 116 | 100 | +16.0% | S$2,384 psf | S$2,369 psf | +0.6% |
| Parc Esta | District 14 | 99 | — | 109 | 132 | -17.4% | S$2,299 psf | S$2,269 psf | +1.4% |
| Rivercove Residences | District 19 | 99 | — | 104 | 3 | +3366.7% | S$1,627 psf | S$1,336 psf | — |
| Riverfront Residences | District 19 | 99 | — | 99 | 73 | +35.6% | S$1,744 psf | S$1,711 psf | +1.9% |
| The Florence Residences | District 19 | 99 | — | 91 | 9 | +911.1% | S$1,881 psf | S$1,834 psf | — |
| Affinity At Serangoon | District 19 | 99 | — | 88 | 3 | +2833.3% | S$1,853 psf | S$1,722 psf | — |
| Serangoon Garden Estate | District 19 | 999 | — | 87 | 89 | -2.3% | S$2,039 psf | S$1,844 psf | +10.5% |
| Jadescape | District 20 | 99 | — | 78 | 95 | -17.9% | S$2,349 psf | S$2,230 psf | +5.3% |
| Parc Clematis | District 5 | 99 | — | 75 | 34 | +120.6% | S$2,255 psf | S$2,059 psf | +9.6% |
| D'Leedon | District 10 | 99 | — | 72 | 51 | +41.2% | S$2,082 psf | S$2,047 psf | +1.7% |
| Midwood | District 23 | 99 | — | 62 | 25 | +148.0% | S$1,915 psf | S$1,927 psf | -0.6% |
| High Park Residences | District 28 | 99 | — | 61 | 101 | -39.6% | S$1,652 psf | S$1,619 psf | +2.0% |
| Sims Urban Oasis | District 14 | 99 | — | 61 | 61 | 0.0% | S$1,944 psf | S$1,910 psf | +1.8% |
| Sol Acres | District 23 | 99 | — | 61 | 98 | -37.8% | S$1,534 psf | S$1,476 psf | +4.0% |
Rivercove Residences went from three resales to 104
Rivercove Residences in District 19 recorded 104 resales, against three in the four quarters before. Affinity At Serangoon rose from three to 88. The Florence Residences rose from nine to 91.
The earlier counts at those three projects are too small for a median comparison, and no change in median is shown for them. Parc Clematis in District 5 traded 75 times, up 120.6%, with its median up 9.6% to S$2,255 psf.
Tampines led the HDB towns with 1,774 resales
Tampines recorded 1,774 HDB resales, down 10.0% from 1,970. Its median rose 1.8% to S$6,650 psm.
Woodlands was second with 1,705 resales, down 11.9%. Sengkang followed with 1,698, down 17.8%. Pasir Ris and Toa Payoh were among the towns that traded more than before.
| Town | Resales Q3 2025 to Q2 2026 | Resales Q3 2024 to Q2 2025 | Change in count | Median psm now | Median psm before | Change in median |
|---|---|---|---|---|---|---|
| Tampines | 1,774 | 1,970 | -10.0% | S$6,650 psm | S$6,533 psm | +1.8% |
| Woodlands | 1,705 | 1,935 | -11.9% | S$5,714 psm | S$5,644 psm | +1.2% |
| Sengkang | 1,698 | 2,067 | -17.8% | S$6,848 psm | S$6,774 psm | +1.1% |
| Punggol | 1,559 | 1,774 | -12.1% | S$7,500 psm | S$7,170 psm | +4.6% |
| Yishun | 1,514 | 1,741 | -13.0% | S$6,174 psm | S$6,056 psm | +1.9% |
| Jurong West | 1,438 | 1,761 | -18.3% | S$5,637 psm | S$5,482 psm | +2.8% |
| Bukit Batok | 1,243 | 1,519 | -18.2% | S$6,796 psm | S$6,429 psm | +5.7% |
| Hougang | 1,227 | 1,284 | -4.4% | S$6,554 psm | S$6,417 psm | +2.1% |
| Bedok | 1,152 | 1,215 | -5.2% | S$6,352 psm | S$6,269 psm | +1.3% |
| Choa Chu Kang | 978 | 1,130 | -13.5% | S$5,578 psm | S$5,444 psm | +2.5% |
| Toa Payoh | 968 | 917 | +5.6% | S$7,826 psm | S$7,321 psm | +6.9% |
| Sembawang | 899 | 1,174 | -23.4% | S$6,613 psm | S$6,738 psm | -1.9% |
| Ang Mo Kio | 873 | 1,028 | -15.1% | S$6,284 psm | S$6,187 psm | +1.6% |
| Bukit Merah | 862 | 964 | -10.6% | S$8,570 psm | S$8,800 psm | -2.6% |
| Bukit Panjang | 748 | 820 | -8.8% | S$6,228 psm | S$6,035 psm | +3.2% |
| Kallang/Whampoa | 708 | 860 | -17.7% | S$7,860 psm | S$7,551 psm | +4.1% |
| Pasir Ris | 671 | 611 | +9.8% | S$6,032 psm | S$5,827 psm | +3.5% |
| Geylang | 646 | 654 | -1.2% | S$6,681 psm | S$6,730 psm | -0.7% |
| Queenstown | 632 | 659 | -4.1% | S$10,320 psm | S$8,842 psm | +16.7% |
| Clementi | 522 | 523 | -0.2% | S$6,772 psm | S$6,484 psm | +4.4% |
| Jurong East | 453 | 520 | -12.9% | S$5,879 psm | S$5,809 psm | +1.2% |
| Bishan | 369 | 376 | -1.9% | S$8,083 psm | S$8,018 psm | +0.8% |
| Serangoon | 365 | 396 | -7.8% | S$7,007 psm | S$6,913 psm | +1.4% |
| Central Area | 172 | 166 | +3.6% | S$9,067 psm | S$8,917 psm | +1.7% |
| Marine Parade | 130 | 157 | -17.2% | S$7,385 psm | S$7,231 psm | +2.1% |
| Bukit Timah | 57 | 54 | +5.6% | S$8,883 psm | S$8,607 psm | +3.2% |
Queenstown median psm rose 16.7%
Queenstown posted the largest median move among the HDB towns, up 16.7% to S$10,320 psm on 632 resales. Toa Payoh rose 6.9% to S$7,826 psm. Bukit Batok rose 5.7% to S$6,796 psm.
Three towns recorded lower medians. Bukit Merah fell 2.6% to S$8,570 psm. Sembawang fell 1.9% and Geylang 0.7%.
Twenty-six HDB towns were ranked in the window. Bukit Timah had the fewest resales at 57, up 5.6% from 54. Among the 15 private projects, only Midwood posted a lower median, down 0.6% to S$1,915 psf.
Method: resale caveats and HDB resale records over the four completed quarters named, counted per project and per town, against the four quarters before. Medians are of price per square metre. They are shown per square foot for private homes and per square metre for HDB. The change in median is shown only where the earlier window has enough sales (10 for a project, 30 for a town). Private figures are from URA Data Service caveats, HDB figures from data.gov.sg resale records, both loaded weekly by this site's ingest. Medians are of the non-excluded transactions in the period named. Sales flagged by the hygiene rules (related-party transfers, bulk deals, outliers) are left out. Every figure is indicative and drawn from recorded transactions, not a formal valuation.